volshow
Display volume
Syntax
Description
Numeric Array
vol = volshow(V)Volume object that displays the 3-D grayscale, RGB, or binary
volume V. You can rotate and zoom in and out on the display
interactively using the mouse. Use vol to query and modify properties
of the Volume object after you create the object. For a list of
properties, see Volume Properties.
vol = volshow(V,Name=Value)volshow(V,RenderingStyle="Isosurface") displays the 3-D volume
V and sets the rendering style as "Isosurface".
For a list of properties, see Volume Properties.
Blocked Image Volume
Since R2023a
bVol = volshow(bim)BlockedVolume object that displays the 3-D blocked image
bim. You can rotate and zoom in and out on the display
interactively using the mouse. Use bVol to query and modify
properties of the BlockedVolume object after you create the object. For a
list of properties, see BlockedVolume Properties.
bVol = volshow(bim,Name=Value)ResolutionLevel="coarse"
specifies the resolution level to display as the coarsest resolution level. For a list of
properties, see BlockedVolume Properties.
Note
Medical Imaging Toolbox™ extends the functionality of the volshow
(Image Processing Toolbox™) function to display a medicalVolume (Medical Imaging Toolbox) object in the patient coordinate system. For more
information, see volshow (Medical Imaging Toolbox).
Examples
Load MRI data into the workspace and remove the singleton dimension.
load mri
V = squeeze(D);
Generate a colormap and transparency (alpha) map suitable for MRI images.
intensity = [0 20 40 120 220 1024];
alpha = [0 0 0.15 0.3 0.38 0.5];
color = [0 0 0; 43 0 0; 103 37 20; 199 155 97; 216 213 201; 255 255 255]/255;
queryPoints = linspace(min(intensity),max(intensity),256);
alphamap = interp1(intensity,alpha,queryPoints)';
colormap = interp1(intensity,color,queryPoints);
This MRI scan has a non-uniform, or anisotropic, voxel size of 1-by-1-by-2.5 mm. Specify the transformation matrix that scales the image to the correct voxel dimensions.
sx = 1;
sy= 1;
sz = 2.5;
A = [sx 0 0 0; 0 sy 0 0; 0 0 sz 0; 0 0 0 1];
Create an affinetform3d object that performs the scaling.
tform = affinetform3d(A);
View the volume with the custom colormap, transparency map, and transformation. Drag the mouse to rotate the volume. Use the scroll wheel to zoom in and out of the volume.
vol = volshow(V,Colormap=colormap,Alphamap=alphamap,Transformation=tform);
This example uses a subset of the Medical Segmentation Decathlon data set [1]. The subset of data includes two CT chest volumes and corresponding label images, stored in the NIfTI file format.
Run this code to download the MedicalVolumNIfTIData.zip file from the MathWorks® website, then unzip the file. The size of the data file is approximately 76 MB.
zipFile = matlab.internal.examples.downloadSupportFile("medical", ...
    "MedicalVolumeNIfTIData.zip");
filepath = fileparts(zipFile);
unzip(zipFile,filepath)
The folder dataFolder contains the downloaded and unzipped data.
dataFolder = fullfile(filepath,"MedicalVolumeNIfTIData");Specify the filenames of the volume and label image used in this example.
dataFile = fullfile(dataFolder,"lung_043.nii.gz");
labelDataFile = fullfile(dataFolder,"LabelData","lung_043.nii.gz");
Read the image data and the metadata from the image file.
V = niftiread(dataFile);
info = niftiinfo(dataFile);
Define a transparency map and color map for this volume. The values used in this example were determined using manual trial and error.
alpha = [0 0 0.7 1.0];
color = [0 0 0; 200 140 75; 231 208 141; 255 255 255] ./ 255;
intensity = [-3024 -700 -400 3071];
queryPoints = linspace(min(intensity),max(intensity),256);
alphamap = interp1(intensity,alpha,queryPoints)';
colormap = interp1(intensity,color,queryPoints);
This MRI scan has a nonuniform, or anisotropic, voxel size. Extract the voxel spacing from the file metadata, and define the transformation to display the volume with correct dimensions.
voxelSize = info.PixelDimensions;
sx = voxelSize(2);
sy= voxelSize(1);
sz = voxelSize(3);
A = [sx 0 0 0; 0 sy 0 0; 0 0 sz 0; 0 0 0 1];
Create an affinetform3d object that performs the scaling.
tform = affinetform3d(A);
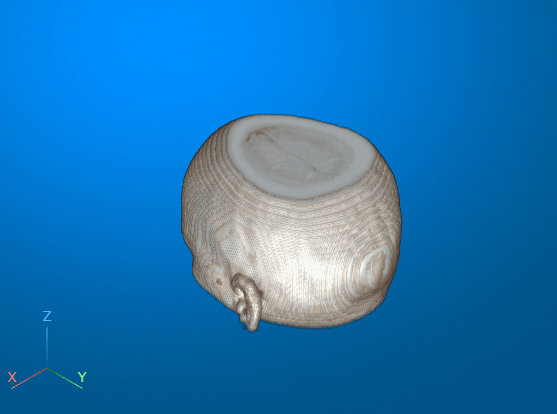
View the volume as a 3-D object. Specify the rendering style as "CinematicRendering". The cinematic rendering style displays the volume based on the specified color and transparency for each voxel, with iterative postprocessing that produces photorealistic shadows and lighting.
viewer = viewer3d;
vol = volshow(V,Parent=viewer, ...
    RenderingStyle="CinematicRendering", ...
    Colormap=colormap, ...
    Alphamap=alphamap, ...
    Transformation=tform);

References
[1] Medical Segmentation Decathlon. "Lung." Tasks. Accessed May 10, 2018. http://medicaldecathlon.com/. The Medical Segmentation Decathlon data set is provided under the CC-BY-SA 4.0 license. All warranties and representations are disclaimed. See the license for details.
Create an RGB volume of red, green, and blue bubbles by using the createRGBBubbles helper function. The helper function is attached to this example as a supporting file.
RGB = createRGBBubbles;
Create a viewer with a black background and a gray background gradient. Display the RGB volume in the viewer.
viewer = viewer3d(BackgroundColor=[0 0 0],GradientColor=[0.2 0.2 0.2]);
vol = volshow(RGB,Parent=viewer,RenderingStyle="GradientOpacity");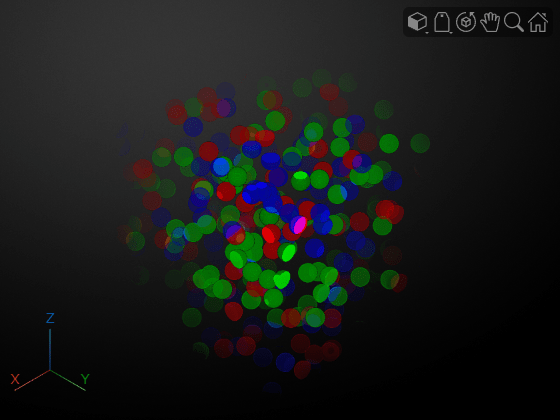
By default, volshow displays the transparency for each voxel by mapping its lightness to the Alphamap property. The lightness of a voxel is similar to the output of the rgb2lightness function for 2-D images.
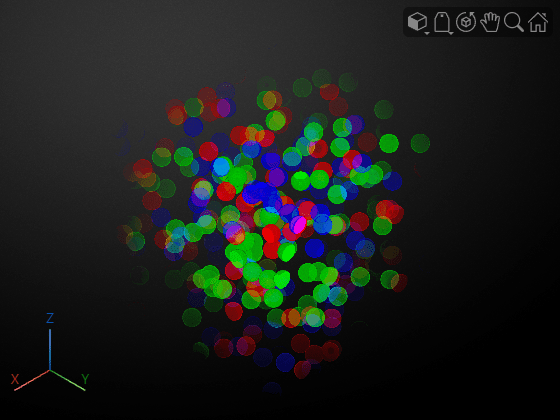
Alternatively, you can specify a custom alpha channel by using the AlphaData property. If you have an RGBA volume, extract the fourth channel by using array indexing and specify the channel as the AlphaData value. For this volume, create an artificial alpha channel of the same size as the volume. The artificial channel is fully transparent for the voxel at the origin and the opacity increases as the distance between the origin and each voxel increases.
sz = 500;
val = linspace(0,1,sz);
[X,Y,Z] = meshgrid(val,val,val);
alpha = X.*Y.*Z;

vol.AlphaData = alpha;
Load a grayscale volume into the workspace and display the volume using volshow.
load("spiralVol.mat")
h = volshow(spiralVol);
viewer = h.Parent;
hFig = viewer.Parent;
drawnow
Specify the name of the GIF file in which to save the animation.
filename = "animatedSpiral.gif";Aim the camera at the center of the volume.
sz = size(spiralVol);
center = sz/2 + 0.5;
viewer.CameraTarget = center;

Specify the number of frames in the animation, then create an array of camera positions in a circle around the center of the volume.
numberOfFrames = 12;
vec = linspace(0,2*pi,numberOfFrames)';
dist = sqrt(sz(1)^2 + sz(2)^2 + sz(3)^2);
myPosition = center + ([cos(vec) sin(vec) ones(size(vec))]*dist);
12;
vec = linspace(0,2*pi,numberOfFrames)';
dist = sqrt(sz(1)^2 + sz(2)^2 + sz(3)^2);
myPosition = center + ([cos(vec) sin(vec) ones(size(vec))]*dist);At each camera position, update the display and write the frame to the GIF file. You can play the file in a video viewer.
for idx = 1:length(vec)
    % Update the current view
    viewer.CameraPosition = myPosition(idx,:);
    % Capture the image using the getframe function
    I = getframe(hFig);
    [indI,cm] = rgb2ind(I.cdata,256);
    % Write the frame to the GIF file
    if idx==1
        % Do nothing. The first frame displays only the viewer, not the
        % volume.
    elseif idx == 2
        imwrite(indI,cm,filename,"gif",Loopcount=inf,DelayTime=0)
    else
        imwrite(indI,cm,filename,"gif",WriteMode="append",DelayTime=0)
    end
end

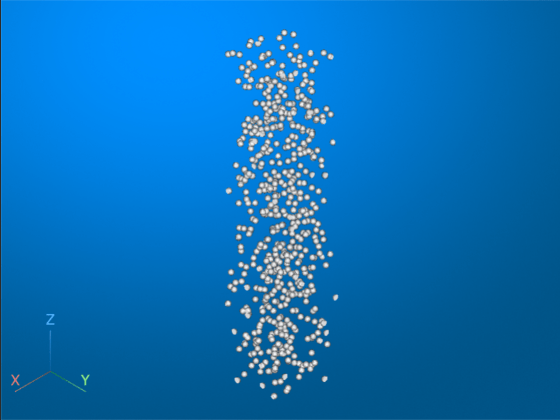
This example creates a large 500-by-500-by-2500 image volume. If your machine does not have enough memory to create and store the 2.5 GB volume, decrease imSize before running this example.
imSize = [500,500,2500];
Create a simulated 3-D image of bubbles, V. This can take several minutes.
V = rand(imSize,"single");
BW = false(size(V));
BW(V < 0.000001) = true;
V = bwdist(BW);
V(V <= 20) = 1;
V(V > 20) = 0;
If you try to display V directly, volshow returns an error that the volume is too large. Instead, create a blockedImage object that points to V and has a block size of 500-by-500-by-500 voxels.
bim = blockedImage(V,BlockSize=[500,500,500]);
Display the blockedImage using volshow. The volshow function reads blocks into memory one at a time and stitches individual block renderings to produce the final volume.
bVol = volshow(bim);
Input Arguments
Name-Value Arguments
Output Arguments
More About
Tips
To refresh a volume display efficiently, update properties of the
Volumeobject returned byvolshowinstead of repeatedly calling thevolshowfunction. For example, refresh the volume and overlay data by updating theDataandOverlayDataproperties, respectively, using dot notation. Updating an existing display avoids the memory and performance cost of creating a new parent viewer. Updating the data also preserves other settings that control the appearance of the scene, such as camera properties and the background color. This table compares approaches for updating the volume data in avolshowdisplay.More Efficient Less Efficient V = volshow(volIntensity); % Binarize the volume volBinary = volIntensity > 10; % Update the display to show the binary volume V.Data = volBinary;
volshow(volIntensity);

% Binarize the volume
volBinary = volIntensity > 10;

% Create a new viewer and display the binary volume
volshow(volBinary)
Version History
Introduced in R2018bSee Also
Volume
Viewer | Volume Properties | BlockedVolume Properties | viewer3d | Surface | isosurface | slice | obliqueslice
Topics
- Display Volume Using Cinematic Rendering
- Display Interior Labels by Clipping Volume Planes
- Display Interior Labels by Adjusting Volume Overlay Properties
- Remove Objects from Volume Display Using 3-D Scissors
- Display Large 3-D Images Using Blocked Volume Visualization
- Display Translucent Volume with Advanced Light Scattering