isosurface
Extract isosurface data from volume data
Syntax
Description
An isosurface is a 3-D surface representation of points with equal values in a 3-D
data distribution. The isosurface function computes and draws a surface by
connecting points of a constant value within a volume of space.
Plot Isosurface
Compute Isosurface Data as Structure
s = isosurface(___,'verbose')
s = isosurface(___,'noshare')
Examples
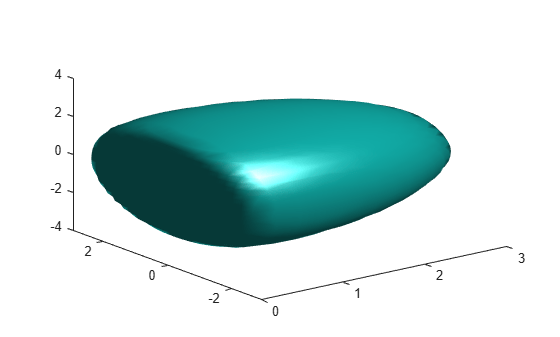
Create 3-D grid coordinates by using meshgrid and create volume data V. Then, create an isosurface within the volume by connecting points at the value .0001. Plot the isosurface.
[x,y,z] = meshgrid([-3:0.25:3]);
V = x.*exp(-x.^2 -y.^2 -z.^2);
isosurface(x,y,z,V,1e-4);
Create an isosurface where the isovalue is 0.0001. Return the locations of the faces and vertices for the resulting surface in a structure.
[x,y,z] = meshgrid([-3:0.25:3]);
V = x.*exp(-x.^2 -y.^2 -z.^2);
s = isosurface(x,y,z,V,1e-4)
s = struct with fields:
    vertices: [1693×3 double]
       faces: [3348×3 double]
Create an isosurface where the isovalue is .0001. Return the locations of the faces and vertices for the resulting surface as separate arrays.
[x,y,z] = meshgrid([-3:0.25:3]);
V = x.*exp(-x.^2 -y.^2 -z.^2);
[faces,verts] = isosurface(x,y,z,V,1e-4)
faces = 3348×3

     1     2     3
     1     4     2
     2     4     5
     4     6     5
     5     6     7
     6     8     7
     9    10    11
     9    12    10
    10    12    13
    12    14    13
    13    14     1
    13     1     3
     1    14     4
     4    14    15
     4    15     6
      ⋮
verts = 1693×3

    0.2500   -0.2500   -2.7918
    0.2181   -0.2500   -2.7500
    0.2500   -0.4366   -2.7500
    0.2500         0   -2.8092
    0.2049         0   -2.7500
    0.2500    0.2500   -2.7918
    0.2181    0.2500   -2.7500
    0.2500    0.4366   -2.7500
    0.5000   -0.7500   -2.7935
    0.4165   -0.7500   -2.7500
    0.5000   -0.8435   -2.7500
    0.5000   -0.5000   -2.8698
    0.2699   -0.5000   -2.7500
    0.5000   -0.2500   -2.9054
    0.5000         0   -2.9158
      ⋮
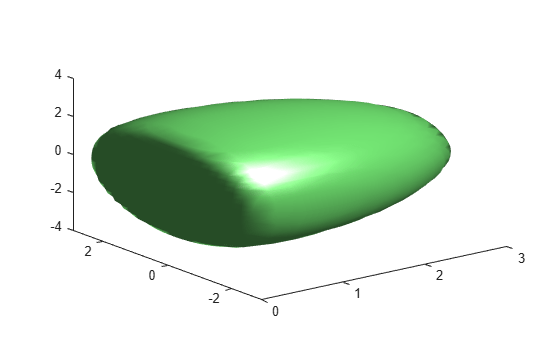
Create an isosurface where the isovalue is 0.0001. Compute the locations of the faces and vertices as a structure. Then, plot the face and vertex data by passing the structure data to the patch function. Adjust the view of the plot, change the surface colors, and specify custom lighting.
[x,y,z] = meshgrid([-3:0.25:3]);
V = x.*exp(-x.^2 -y.^2 -z.^2);
s = isosurface(x,y,z,V,1e-4);
p = patch(s);
isonormals(x,y,z,V,p)
view(3);
set(p,'FaceColor',[0.5 1 0.5]);
set(p,'EdgeColor','none');
camlight;
lighting gouraud;
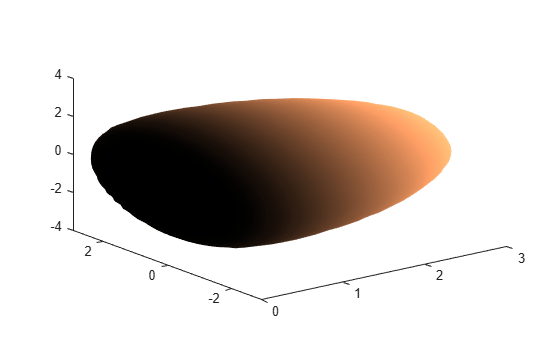
Visualize the flow data but color code the surface to indicate magnitude along the x-axis. First, compute the color data by specifying a vector containing a scalar value for each vertex in the isosurface. The colors are mapped to the current colormap.
[x,y,z] = meshgrid([-3:0.25:3]);
V = x.*exp(-x.^2 -y.^2 -z.^2);
[faces,verts,colors] = isosurface(x,y,z,V,1e-4,x);
Then, plot the isosurface with the computed color data by passing the data to the patch function. Set the camera angle and aspect ratio and change the colormap.
patch('Vertices',verts,'Faces',faces,'FaceVertexCData',colors,...
    'FaceColor','interp','EdgeColor','interp')
view(3)
colormap copper
Input Arguments
Output Arguments
Tips
If you want to specify a custom camera view, lighting, or a different color map of the surface, use the
patchfunction to plot the data returned fromisosurface. You can pass the structure created byisosurfacedirectly to thepatchcommand. For example:s = isosurface(X,Y,Z,V,isovalue); patch(s)
Alternatively, you can pass the individual faces and vertices arrays to patch by specifying property names. For example:
[faces,verts] = isosurface(X,Y,Z,V,isovalue) ;
patch('Faces',faces,'Vertices',verts);
Extended Capabilities
Version History
Introduced before R2006a
See Also
isonormals | shrinkfaces | smooth3 | contour | meshgrid | contourslice