phasedelay
Phase delay of digital filter
Syntax
Description
phasedelay(___) plots the phase
delay response versus frequency.
Examples
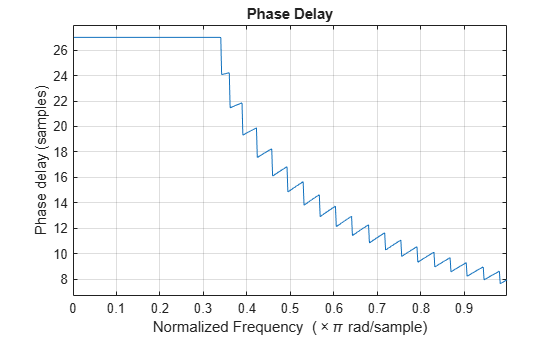
Use constrained least squares to design a lowpass FIR filter of order 54 and normalized cutoff frequency 0.3. Specify the passband ripple and stopband attenuation as 0.02 and 0.08, respectively, expressed in linear units. Compute and plot the phase delay response of the filter.
Ap = 0.02;
As = 0.008;

b = fircls1(54,0.3,Ap,As);
phasedelay(b)
Repeat the example using designfilt. Keep in mind that this function expresses the ripples in decibels.
Apd = 40*log10((1+Ap)/(1-Ap));
Asd = -20*log10(As);

d = designfilt('lowpassfir','FilterOrder',54,'CutoffFrequency',0.3, ...
               'PassbandRipple',Apd,'StopbandAttenuation',Asd);
phasedelay(d)

Since R2024b
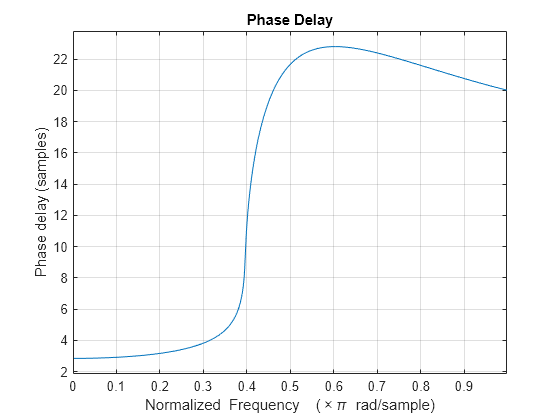
Design a 40th-order lowpass Chebyshev type II digital filter with a stopband edge frequency of 0.4 and stopband attenuation of 50 dB. Plot the phase delay response of the filter using its coefficients in the CTF format.
[B,A] = cheby2(40,50,0.4,"ctf");

phasedelay(B,A,"ctf")
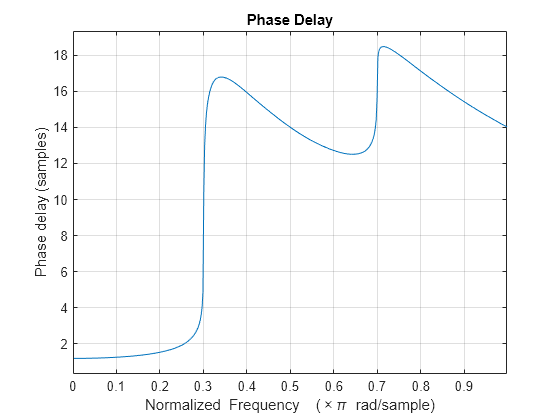
Design a 30th-order bandpass elliptic digital filter with passband edge frequencies of 0.3 and 0.7, passband ripple of 0.1 dB, and stopband attenuation of 50 dB. Plot the phase delay response of the filter using its coefficients and gain in the CTF format.
[B,A,g] = ellip(30,0.1,50,[0.3 0.7],"ctf");
phasedelay({B,A,g},"ctf")
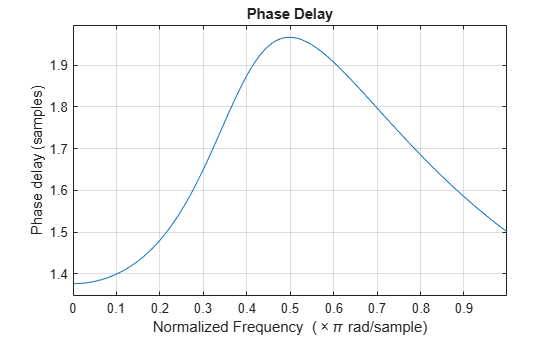
Design a third-order lowpass Butterworth filter with a cutoff frequency of 200 Hz. The sample rate is 1000 Hz.
fc = 200;
fs = 1000;

[z,p,k] = butter(3,fc/(fs/2),'low');
Use the zp2sos function to convert the zeros, poles, and gain to second-order sections. Compute the phase delay response of the filter and set the number of evaluation points to 1024. Display the result.
sos = zp2sos(z,p,k);
phasedelay(sos,1024)
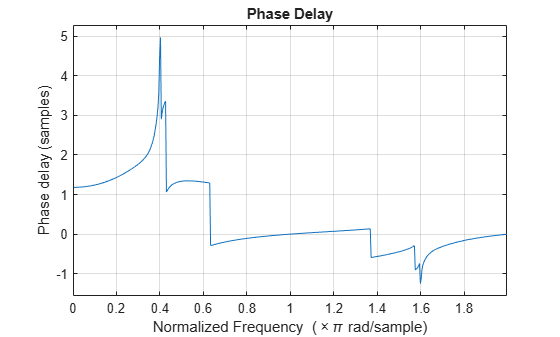
Design an elliptic filter of order 10 and normalized passband frequency 0.4. Specify a passband ripple of 0.5 dB and a stopband attenuation of 20 dB. Display the phase delay response of the filter over the complete unit circle.
[b,a] = ellip(10,0.5,20,0.4);
phasedelay(b,a,512,'whole')
Repeat the example using designfilt.
d = designfilt('lowpassiir','DesignMethod','ellip','FilterOrder',10, ...
               'PassbandFrequency',0.4, ...
               'PassbandRipple',0.5,'StopbandAttenuation',20);
phasedelay(d,512,'whole')
Input Arguments
Output Arguments
More About
Tips
You can obtain filters in
CTF format, including the scaling gain. Use the outputs of digital IIR filter design functions,
such as butter, cheby1, cheby2, and ellip. Specify the "ctf" filter-type argument in these
functions and specify to return B, A, and
g to get the scale values. (since R2024b)
Algorithms
The phase delay response of a filter corresponds to the time delay
that each frequency component experiences as the input signal passes through the system. The
phasedelay function returns the phase delay response and the frequency
vector of the filter
given numerator and denominator coefficients in inputs
b and a.
References
[1] Lyons, Richard G. Understanding Digital Signal Processing. Upper Saddle River, NJ: Prentice Hall, 2004.