ucover
Fit uncertain model to set of LTI responses
Syntax
Description
usys = ucover(Parray,Pnom,ord)usys with nominal value
Pnom and whose range of behaviors includes all responses in the LTI
array Parray. The uncertain model structure is of the form , where:
Δ is a
ultidynobject that represents uncertain dynamics with unit peak gain.W is a stable, minimum-phase shaping filter of order
ordthat adjusts the amount of uncertainty at each frequency. For a MIMOPnom, W is diagonal, with the orders of the diagonal elements given byord.
usys = ucover(Parray,Pnom,ord1,ord2,utype)utype.
utype='InputMult'— Input multiplicative form, in whichusys = Pnom*(I + W1*Delta*W2)utype='OutputMult'— Output multiplicative form, in whichusys = (I + W1*Delta*W2)*Pnomutype='Additive'— Additive form, in whichusys = Pnom + W1*Delta*W2
Delta represents uncertain dynamics with unit peak gain, and
W1 and W2 are diagonal, stable, minimum-phase
shaping filters with orders specified by ord1 and
ord2, respectively.
[
improves the fit using initial filter values in the usys,info] = ucover(Pnom,info_in,ord1,ord2)info result. Supply
new orders ord1 and ord1 for W1
and W2. When you are trying different filter orders to improve the
result, this syntax speeds up iteration by letting you reuse previously computed
information.
Examples
Fit an uncertain model to an array of LTI responses. The responses can be, for example, the results of multiple runs to acquire frequency response data from a physical system.
For this example, generate the frequency response data by creating an array of LTI models and sampling the frequency response of those models.
Pnom = tf(2,[1 -2]);
p1 = Pnom*tf(1,[.06 1]);
p2 = Pnom*tf([-.02 1],[.02 1]);
p3 = Pnom*tf(50^2,[1 2*.1*50 50^2]);
array = stack(1,p1,p2,p3);
Parray = frd(array,logspace(-1,3,60));
The frequency response data in Parray represents three separate data acquisition experiments on the system.
Plot the relative errors between the nominal plant response and the three models in the LTI array.
relerr = Pnom\(Pnom-Parray);
bodemag(relerr)
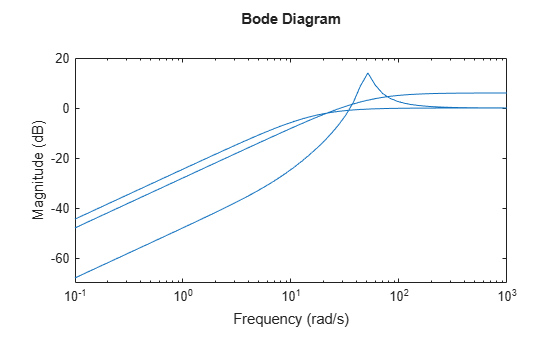
If you use a multiplicative uncertainty model structure, you want the magnitude of the shaping filter to fit the maximum relative error at each frequency. Use this requirement to help choose the order of the shaping filter. First, try a first-order shaping filter.
[P,Info] = ucover(Parray,Pnom,1);
P is an uncertain state-space (uss) model that captures the uncertainty as a ultidyn uncertain dynamics block.
P.Uncertainty
ans = struct with fields:
    Parray_InputMultDelta: [1×1 ultidyn]
The Info structure contains other information about the fit, including the resulting shaping filter, Info.W1. Plot the response to see how well the shaping filter fits the relative errors.
W = Info.W1;
bodemag(relerr,'b--',W,'r',{0.1,1000});
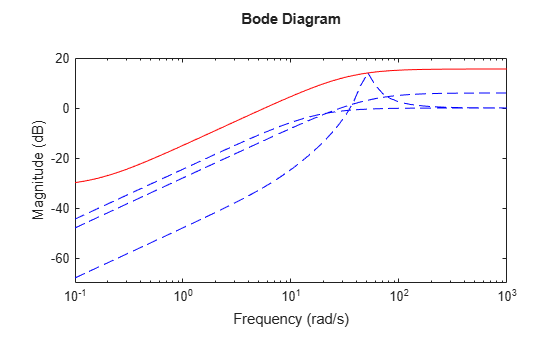
The plot shows that the filter W is too conservative and exceeds the maximum relative error at most frequencies. To obtain a tighter fit, rerun the function using a fourth-order filter.
[P,Info] = ucover(Parray,Pnom,4);
Evaluate the fit by plotting the Bode magnitude plot.
W = Info.W1;
bodemag(relerr,'b--',W,'r',{0.1,1000});
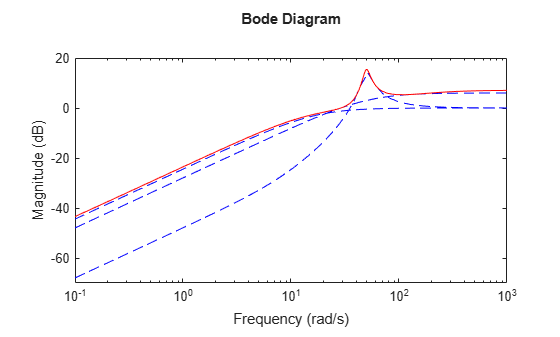
This plot shows that for the fourth-order filter, the magnitude of W closely matches the largest error, yielding the minimum uncertainty that captures all the variation.
Input Arguments
Output Arguments
Algorithms
ucover fits the responses of LTI models in
Parray by modeling the gaps between Parray and the
nominal response Pnom as uncertainty on the system dynamics. To model the
frequency distribution of these unmodeled dynamics, ucover measures the
gap between Pnom and Parray at each frequency on a
grid, and selects shaping filters whose magnitude approximates the maximum gap.
To design the minimum-phase shaping filters W1 and
W2, the ucover command performs two steps:
Compute the optimal values of
W1andW2on a frequency grid.Fit
W1andW2values with the dynamic filters of the specified orders usingfitmagfrd.
The model structure that you obtain using usys = ucover(Parray,Pnom,ord)
corresponds to W1 = W and W2 =
1.
For instance, the following figure shows the relative gap between the nominal response and six LTI responses, enveloped using a second-order shaping filter and a fourth-order filter.
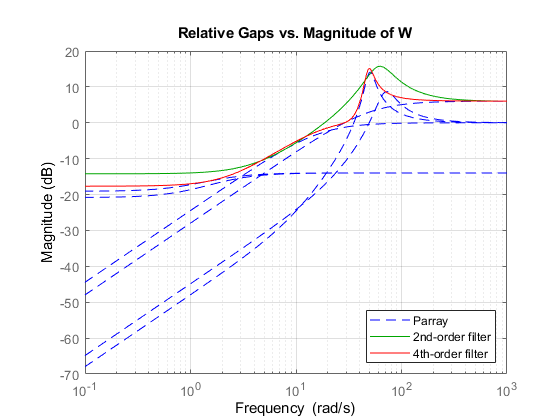
If you use the single-filter syntax usys = ucover(Parray,Pnom,ord), the
software sets the uncertainty to W*Delta, where Delta is
a ultidyn object that represents unit-gain uncertain dynamics. Therefore, the
amount of uncertainty at each frequency is specified by the magnitude of W
and closely tracks the gap between Pnom and Parray. In
the above figure, the fourth-order filter tracks the maximum gap more closely and therefore
yields a less conservative estimate of uncertainty.
Version History
Introduced in R2009b