Interpolate Thermodynamic Data
This example shows how to interpolate data using Spreadsheet Link™ to invoke MATLAB® functions in Microsoft® Excel®.
The example uses the two-dimensional data-gridding interpolation
function griddata on thermodynamic
data, where volume has been measured for time and temperature values.
The griddata function finds the volume values
underlying the two-dimensional time-temperature function for a new
set of time and temperature coordinates.
To organize and display the original data and the interpolated output data, you can use Microsoft Excel worksheets.
Open the ExliSamp.xls file and select the Sheet3 worksheet.
For help finding the ExliSamp.xls file, see Installation.
This worksheet contains measured thermodynamic data in cell
ranges A5 through A29, B5 through B29,
and C5 through C29. The time
and temperature values for interpolation are in cell ranges E7 through E30 and F6 through T6,
respectively.
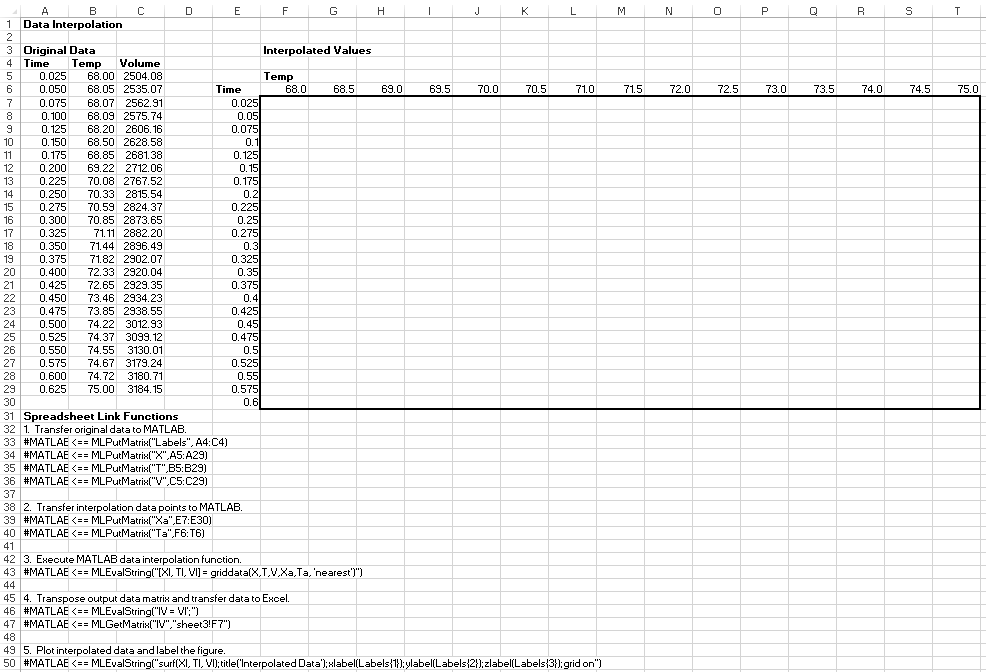
Execute the Spreadsheet Link function that passes the
Time,Temp, andVolumelabels to the MATLAB workspace by double-clicking the cellA33and pressing Enter.Copy the original time data to the MATLAB workspace by executing the function in the cell
A34. To copy the original temperature data, execute the function in the cellA35. To copy the original volume data, execute the function in cellA36.Copy the interpolation time values to the MATLAB workspace by executing the function in cell
A39. To copy the interpolation temperature values, execute the function in cellA40.Execute the function in cell
A43. Thegriddatafunction performs two-dimensional interpolation that generates the interpolated volume data using the inverse distance method.Transpose the interpolated volume data and copy it to the Excel worksheet by executing the functions in cells
A46andA47. The data fills the cell rangeF7:T30.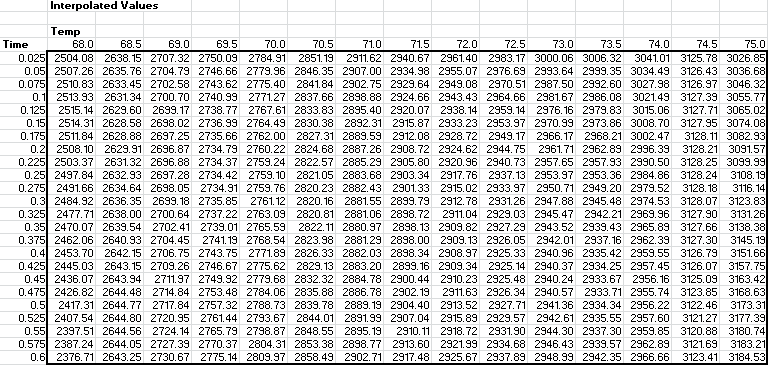
Execute the function in cell
A50. The MATLAB software plots and labels the interpolated data on a three-dimensional color surface, with the color proportional to the interpolated volume data.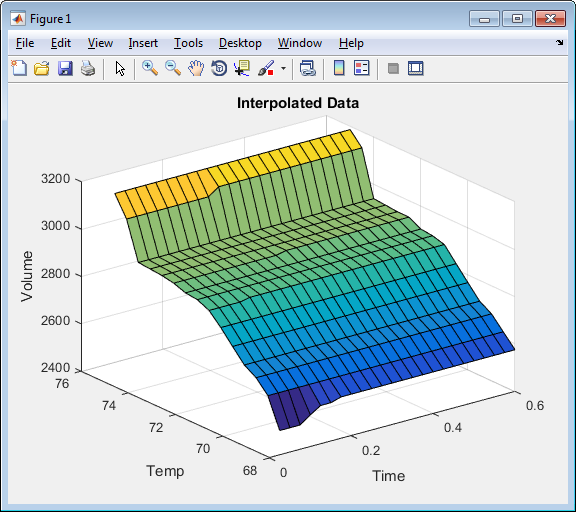
To generate different volume values, close the figure and change the measured thermodynamic data in cells
A5:C29. Then, execute all the Spreadsheet Link functions again. The worksheet updates with new volume rates and MATLAB generates a new figure of the interpolated volume data.
See Also
MLGetMatrix | MLPutMatrix | MLEvalString | griddata | surf