Map Time and Bond Cash Flows
This example shows how to use Financial Toolbox™ and Spreadsheet Link™ to calculate a set of cash flow amounts and dates for a portfolio of five bonds.
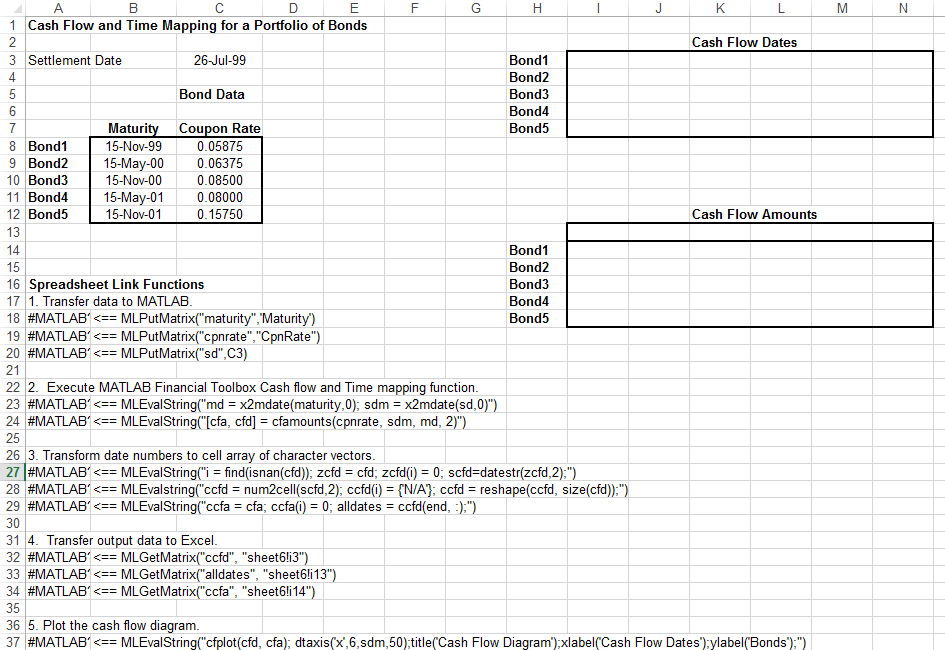
Open the ExliSamp.xls file and select the Sheet6 worksheet.
For help finding the ExliSamp.xls file, see Installation.
This worksheet contains the maturity dates and coupon rates for five bonds.
Note
This example requires Financial Toolbox, Statistics and Machine Learning Toolbox™, and Optimization Toolbox™.
Execute the Spreadsheet Link function that transfers the column vector
Maturityto the MATLAB® workspace by double-clicking the cellA18and pressing Enter.Transfer the column vector
Coupon Rateto the MATLAB workspace by executing the function in cellA19.Transfer the settlement date to the MATLAB workspace by executing the function in cell
A20.Calculate cash flow amounts and dates by executing the Financial Toolbox functions in cells
A23andA24.Transform the dates into a cell array of character vectors by executing the functions in cells
A27throughA29.Transfer the data to the Excel® worksheet by executing the functions in cells
A32throughA34.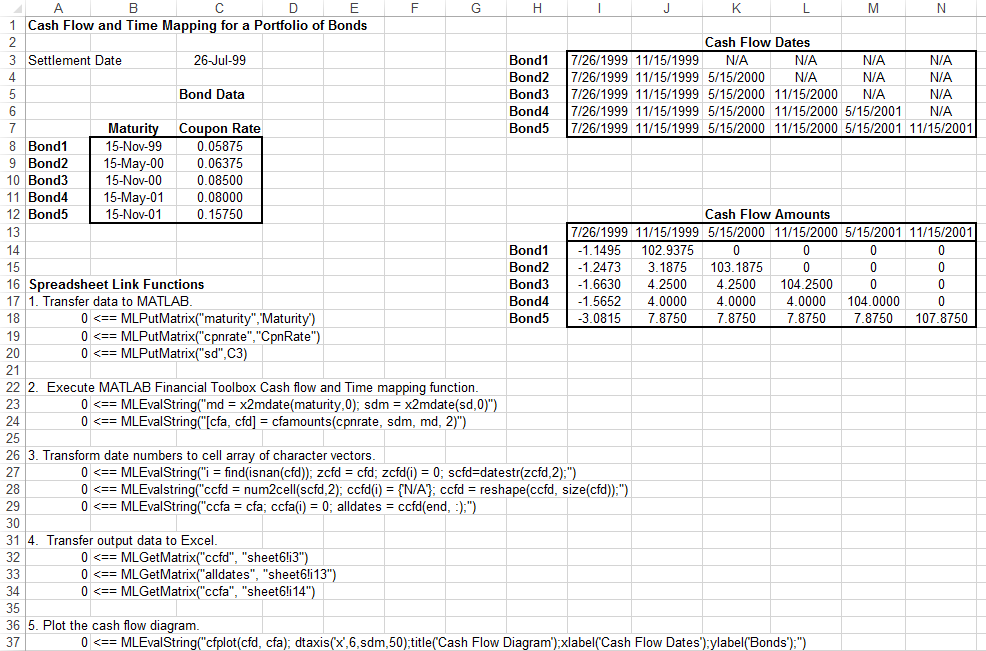
Display a plot of cash flows for each bond by executing the function in cell
A37.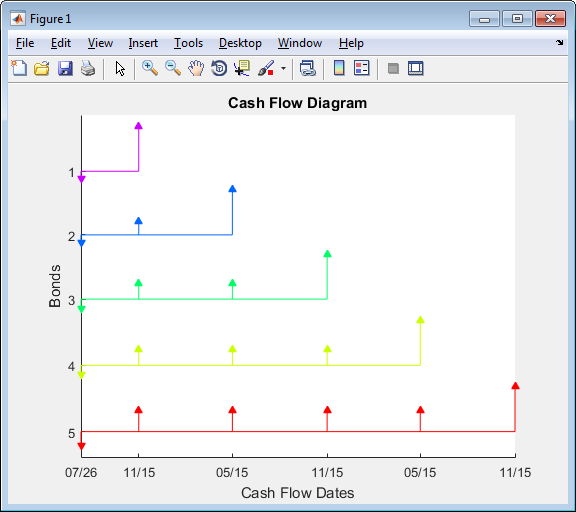
To generate cash flows for a different set of five bonds, close
the figure and change the bond data in cells B8:C12.
Then, execute all the Spreadsheet Link functions again. The
worksheet updates with new cash flow dates and amounts and MATLAB generates
a new figure of the cash flows.
See Also
MLGetMatrix | MLPutMatrix | MLEvalString | cfamounts (Financial Toolbox) | x2mdate | cfplot (Financial Toolbox)