
slice_stl_create_path(triangles,slice_height)
slice stl files and create continuous contour along the slices
This contains the matlab files to slice a stl file and create a continuous contour along which the machine can move for deposition for 3D printing. The main file is slice_stl_create.mThe supporting
- 3.4K (All time)
- 1 (Last 30 days)
- 4.8 / 5
- Community
-
13 May 2021

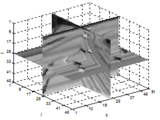
Interactive viewer of 3 orthogonal slices of 3D volume.
Simple interactive viewer of 3 orthogonal slices of 3D volume and of sequence of volumes. The interaction is performed by mouse left button or keyboard arrows.
- 6.3K (All time)
- 5 (Last 30 days)
- 4.5 / 5
- Community
-
21 Jul 2011

Three-dimensional reconstruction from planar slices.
Solid object reconstructed from slice images in parallel planes.
Often three dimensional objects need to be reconstructed from planar images that are taken from slices in destructive testing. This sometimes requires the manual selecting of control points, but in
- 15.4K (All time)
- 2 (Last 30 days)
- 4.4 / 5
- Community
-
1 Sep 2016

GUI for exploration of 3D images (stacks)
- 12.9K (All time)
- 7 (Last 30 days)
- 4.9 / 5
- Community
-
1 Mar 2019

Volume slice visualization gui
GUI for manipulating slices and isosurfaces over a volume.Control over color transparency, contours, and rendering techniques via menus.Original sliceomatic 1.0 for older versions of MATLAB is in the
- 39.5K (All time)
- 3 (Last 30 days)
- 4.4 / 5
- Community
-
1 Sep 2016

ExtractSlice extracts an arbitrary slice, both intensities and indices, from a given volume.
ExtractSlice extracts an arbitrary slice, both intensities and indices, from the input volume given the center and normal of the slice. If you are familiar with IDL, this is the equivalent function
- 2K (All time)
- 1 (Last 30 days)
- 4.5 / 5
- Community
-
12 Aug 2011

Volume slice browser. (3D slice viewer)
Volume slice viewer
This function is designed to view volume slice images of volumetric data. You can adjust the contrast and dynamic range of an image using the interactive window / level function. A log-compressed
- 402 (All time)
- 2 (Last 30 days)
- 4.3 / 5
- Community
-
20 Nov 2019

myslicer - make mouse-interactive slices of a 3-D volume
A minimal "slicer" for the exploration of 3-D volumes using mouse interaction
The code includes a minimalistic software for interactive exploration of 3-D volumes. Its key feature is that the slices may be moved using the mouse pointer. Minimalistic means that it does not
- 2.2K (All time)
- 2 (Last 30 days)
- 5.0 / 5
- Community
-
24 Nov 2009

- 368 (All time)
- 1 (Last 30 days)
- 5.0 / 5
- Community
-
18 Feb 2014
Here you find an excellent result abou the concept of "Gray Level Slicing"
Image Enhancement is one of the fundamental concept for the learners, here i gave my support with program for the better understanding of the concept called "Gray Level Slicing" one of the "Point
- 506 (All time)
- 1 (Last 30 days)
- 5.0 / 5
- Community
-
23 Sep 2015
Enables reading 2 dim slices of 3 dim matrix stored in MAT file
This project demonstrates a simple example of extracting a 2-dim slice of a 3-dim matrix stored in a MAT file without needing to read in the entire MAT file. This may be useful when the full 3-dim
- 1.7K (All time)
- 1 (Last 30 days)
- 5.0 / 5
- Community
-
1 Sep 2016
Network Slicing Optimization for WSN
Network Slicing Optimization for WSN
Analized, High Reliability Slice (e.g., for critical sensors)Low Latency Slice (e.g., for urgent data)Energy Efficient Slice (e.g., for battery-saving)
- 32 (All time)
- 2 (Last 30 days)
- 5.0 / 5
- Community
-
27 Apr 2025
Inversion every 2D slice for arbitrary Multi-dimension array.
Inverse every 2D slice for an arbitrary N-D array (M).
Inverse every 2D matrix slice (the first two dimensions) for multi-dimensional array M: M(:,:,p,q,...) * X(:,:,p,q,...) = repmat(eye(m),[1,1,p,q,...]),where input M is a N-D array (m x m x [p x q x
- 1.1K (All time)
- 1 (Last 30 days)
- 5.0 / 5
- Community
-
27 Apr 2011

Direct Fourier Reconstruction of a Tomographic Slice
Experiments of reconstruction using Fourier Slice Theorem (rather than filtered back projection).
Direct Fourier Reconstruction of a Tomographic SliceExperiments of reconstruction using Fourier Slice Theorem (rather than filtered back projection, FBP).The implementation reconstructs a tomographic
- 1.3K (All time)
- 5 (Last 30 days)
- 5.0 / 5
- Community
-
15 Jun 2018

This function will draw multiple MR images in 3D space using DICOM header information
The three-dimensional viewing of MRI images can help understand the position of (double) oblique slices as often used in cardiac MRI. The function returns a figure handle which can be used as input
- 2.5K (All time)
- 2 (Last 30 days)
- 4.5 / 5
- Community
-
10 Jun 2010

- 11.4K (All time)
- 19 (Last 30 days)
- 4.9 / 5
- Community
-
1 Aug 2024
slicing image with background using 2 threshold values
slicing image with background using 2 threshold values
slicing image with background using 2 threshold values
- 740 (All time)
- 1 (Last 30 days)
- 5.0 / 5
- Community
-
13 Nov 2010

A 3D volumetric data slice viewer for viewing 3D data in different orientations.
This tool allow users to view 3D data in different orientations slice by slice. It is useful to view 3D medical image data (or general 3D volumetric data). It supports many user interactive
- 2.5K (All time)
- 1 (Last 30 days)
- 4.6 / 5
- Community
-
9 May 2011

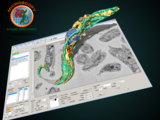
Laser Cut Slicer in MATLAB / Porsche 917K
Laser Cut Slicer in MATLAB / Porsche 917KThis MATLAB code helps you to realize a 3d object with stacked laser cut plates:Extract the intersection of a 3d STL object and a cut plane, visualize, and
- 180 (All time)
- 2 (Last 30 days)
- 5.0 / 5
- Community
-
4 Nov 2021
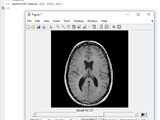
imshow3D:(3D imshow) Displays 3D images slice by slice.Intensity adjusting & slice browsing by mouse
imshow3D displays 3D grayscale or RGB images in a slice by slice fashion with mouse-based slice browsing and window and level adjustment control, and auto slice browsing control.Usage:imshow3D (
- 18.5K (All time)
- 22 (Last 30 days)
- 4.9 / 5
- Community
-
29 Oct 2018
Dicom directory (of slices) to 3D volume image
Read a series of dicom slice images to a 3D volume image and meta data.
This function reads all good dicom files in a given directory and outputs a volume image. The slices are sorted by the SliceLocation tag in the image header. If no directory is specified, it opens
- 10.3K (All time)
- 1 (Last 30 days)
- 3.8 / 5
- Community
-
7 Apr 2009

Slicing 3-D data: Obtaining Coordinates of Contour Polygons
For MATLAB 7 or later. Returns actual coordinates of polygons representing contour lines ....
than one, contour altitude(s)If v is a scalar:[xc,yc] = Column vectors containing the NaN-delimited polygon(s) defining the contour slice at altitude vIf v is a vector:[xc,yc] = Cell arrays of column
- 4.3K (All time)
- 2 (Last 30 days)
- 5.0 / 5
- Community
-
9 Sep 2005

Renders a 2-D image in 3-D space using a texture mapped rectangle, with several examples of uses.
includes:imagesc3, a scaled version of image3slice3, display slices fast from 3-D volume databox3, display a box from 3-D volume datascatterim2, make a 2-D scatter plot using imagesI originally created this code to
- 7.4K (All time)
- 1 (Last 30 days)
- 5.0 / 5
- Community
-
26 Oct 2008
Bit-slicing function for integer matrices
function E = bitreslice(A,b_old, b_new, echo_on) Re-packages bits of a matrix of integers.
b_new to work.Inputs:A - An M by N matrix of unsigned integersb_old - Number of bits to represent A, should be based on maximum valueb_new - New number of bits to slice each
- 266 (All time)
- 1 (Last 30 days)
- 5.0 / 5
- Community
-
12 Dec 2011

【Light Version 】Matlab STL GUI slice program
Transform 3D STL file (StereoLithography) into 2D series BMP files.
Slicing_project.m file w/ matlab. 2. Run it/F5. Enjoy it. ========================================GUI troubleshooting ========================[step 1] Open GUIDE under ("new/App/GUIDE").[step 2] Open 'Slicing
- 1.1K (All time)
- 6 (Last 30 days)
- 5.0 / 5
- Community
-
16 Nov 2017

App for exploring higher dimensional data using volumetric visualizations and animation.
- 6.8K (All time)
- 2 (Last 30 days)
- 4.9 / 5
- Community
-
1 Sep 2016

A GUI to help create transparent 3D isosurface maps of volumetric data.
IsoSlicer is a MATLAB GUI to help create a 3D equivelent of a contourplot for volumetric data. The product is a figure with a series of overlayed transparent iso-layers created using the MATLAB
- 738 (All time)
- 1 (Last 30 days)
- 5.0 / 5
- Community
-
7 Jul 2016

Slice a Delaunay mesh
sliceDelaunay.m returns the cross-section points of a plane for a delaunay triangulation meshing.
- 447 (All time)
- 1 (Last 30 days)
- 5.0 / 5
- Community
-
27 Jul 2016
- 3.6K (All time)
- 2 (Last 30 days)
- 5.0 / 5
- Community
-
26 May 2010

- 17.3K (All time)
- 19 (Last 30 days)
- 4.6 / 5
- Community
-
28 May 2017
- 2.9K (All time)
- 1 (Last 30 days)
- 5.0 / 5
- Community
-
17 Jan 2017

imshow3Dfull displays 3D images slice by slice in 3 orthogonal views, with mouse control
imshow3Dfull is an extended version of imshow3D. It displays 3D grayscale or RGB images from three perpendicular views(i.e. axial, sagittal, and coronal) in slice by slice fashion with mouse based
- 4.4K (All time)
- 6 (Last 30 days)
- 5.0 / 5
- Community
-
29 Oct 2018

View 3D data slice by slice using imagesc
imagesc3D displays 3D images using imagesc fuction from 3 perpendicularviews (i.e. 3 (e1-e2 planes), 1 (e2-e3 planes), 2 (e3-e1 planes), )) in slice by slice fashion with mouse based slice browsing
- 487 (All time)
- 2 (Last 30 days)
- 5.0 / 5
- Community
-
27 Mar 2018

- 4K (All time)
- 18 (Last 30 days)
- 5.0 / 5
- Community
-
15 Jul 2024
conversion of Image to black & white image
convertion of image to black and white image using slicing image without background.
convertion of image to black and white image using slicing image without background.we have to inter two thresholdvalues for doing that...
- 661 (All time)
- 1 (Last 30 days)
- 5.0 / 5
- Community
-
25 Aug 2015

MP3 a medical imaging toolbox (MRI, CT, PET...)
Medical software for Processing multi-Parametric images Pipelines
- 1.3K (All time)
- 7 (Last 30 days)
- 5.0 / 5
- Community
-
18 Aug 2023

- 1.6K (All time)
- 2 (Last 30 days)
- 5.0 / 5
- Community
-
18 Jun 2023

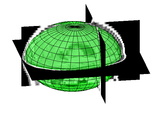
Phased Array Design Toolbox v2.5
A toolbox allowing rapid definition and evaluation of 2D and 3D phased array antennas.
- 21.2K (All time)
- 17 (Last 30 days)
- 4.9 / 5
- Community
-
18 Sep 2015

Frames slices and plots a line where two slices intersect.
This function is built around MATLAB's slice function. It plots a black line along the edges of each slice and a dotted line where two slices intersect. This may be useful to help in the
- 1K (All time)
- 1 (Last 30 days)
- 5.0 / 5
- Community
-
19 Apr 2005
- 1.5K (All time)
- 1 (Last 30 days)
- 5.0 / 5
- Community
-
28 Aug 2019

Spherical hough transform for 3D images
SphericalHough detects spherical structures from 3D images - determines object center and radius
- 2.3K (All time)
- 3 (Last 30 days)
- 4.8 / 5
- Community
-
22 Oct 2014

- 1.8K (All time)
- 2 (Last 30 days)
- 5.0 / 5
- Community
-
10 Feb 2023

- 367 (All time)
- 8 (Last 30 days)
- 5.0 / 5
- Community
-
13 Feb 2024
Microscopy Image Browser (MIB)
MIB is a package for segmentation of multi-dimensional (2D-4D) microscopy datasets
- 1.3K (All time)
- 5 (Last 30 days)
- 5.0 / 5
- Community
-
9 Feb 2019

Set of functions performing ct reconstruction tasks
backprojection using a 2D Fourier transformation, and a filtered back projection using the central slice theorem.It includes the function myCtRecontructionthat should run out of the box and uses Matlab's Shepp
- 10.3K (All time)
- 4 (Last 30 days)
- 4.6 / 5
- Community
-
29 Mar 2017
- 43.5K (All time)
- 9 (Last 30 days)
- 4.9 / 5
- Community
-
28 Feb 2022

AMebius-slicer(STL slicer, gcode generator for 3D print)
A stl files slicer to generate gcode file for real printing
AM slicer can generate gcode from STL file, you can define printer parameters, and some print settings This is only a basic version, the slicer has passed the actual printing test, and has built in
- 678 (All time)
- 4 (Last 30 days)
- 5.0 / 5
- Community
-
13 Jun 2021
- 1.1K (All time)
- 2 (Last 30 days)
- 4.7 / 5
- Community
-
31 Jan 2017
Calculation of CT MTF and NPS using the ACR accreditation phantom
This code enables measurements of CT MTF and NPS from images of an ACR accreditation phantom.
data directory to be selected in which there are only two subdirectories containing only CT slices corresponding to the third module of the phantom. Be careful of partial volume effects with surrounding
- 2K (All time)
- 5 (Last 30 days)
- 4.5 / 5
- Community
-
25 Apr 2013
GUI for visualization of data volumes via slices, contour lines, isosurfaces, and animation.
displays scalar 3-D datasets, essentially functions of three variables, by means of static and animated slices (the latter can be saved as movies), contour slices, and iso-surfaces.The main differences
- 8.8K (All time)
- 2 (Last 30 days)
- 4.6 / 5
- Community
-
18 Nov 2009

2D and 3D Gabor Filter Creators
Can generate 2D or 3D Gabor filter kernels. Parameters enable almost any kernel to be created.
functionality sz = size of gabor kernel created [optional, size set automatically to 3 standard deviations of gaussian kernel]>> help slice_slider slice_slider(3d_volume) plots a 3d
- 2.3K (All time)
- 1 (Last 30 days)
- 4.0 / 5
- Community
-
9 Jul 2013

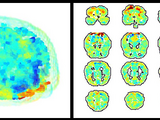
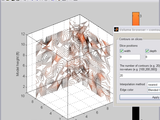
DTI Fiber Tractography (Streamline Tracking Technique)
Diffusion MRI, DTI, Fiber Tracking, Diffusion Tensor Calculation, Fiber Visualization
- 2.9K (All time)
- 2 (Last 30 days)
- 4.8 / 5
- Community
-
11 Oct 2012

Light Field Toolbox v0.4 -- deprecated, v0.5 available now
A set of tools for working with light field (aka plenoptic) imagery in Matlab
- 7.7K (All time)
- 5 (Last 30 days)
- 5.0 / 5
- Community
-
28 Apr 2020

- 590 (All time)
- 1 (Last 30 days)
- 5.0 / 5
- Community
-
20 Jun 2024

This program plots spectrograms (intensities versus frequencies, plotted against time).
This program plots spectrograms (vertical slices of intensities versus frequencies, with slices plotted against time). PlotSpectrogram is designed for ease of use. Features:• Intensities are in log
- 4.5K (All time)
- 2 (Last 30 days)
- 4.5 / 5
- Community
-
19 Jun 2009

- 64 (All time)
- 7 (Last 30 days)
- 5.0 / 5
- Community
-
23 May 2024

- 1.7K (All time)
- 3 (Last 30 days)
- 5.0 / 5
- Community
-
12 Jun 2019

Infill Patterns and Shell Contours - 3D Printing Slice Data
Functions to add a simple alternating rectilinear infill pattern and additional shell contours to outline slice data.
The main function is add_features.add_shell, add_infill and process_slice_data are supporting functions.plot_slices is used to visualise the results.It is recommended to use other functions to
- 199 (All time)
- 1 (Last 30 days)
- 5.0 / 5
- Community
-
9 May 2021
- 820 (All time)
- 13 (Last 30 days)
- 5.0 / 5
- Community
-
13 Sep 2022