SemiSupervisedGraphModel
Semi-supervised graph-based model for classification
Description
You can use a semi-supervised graph-based method to label unlabeled data by using
the fitsemigraph
function. The resulting SemiSupervisedGraphModel object contains the fitted
labels for the unlabeled observations (FittedLabels) and their scores
(LabelScores). You can also use the
SemiSupervisedGraphModel object as a classifier, trained on both the
labeled and unlabeled data, to classify new data by using the predict
function.
Creation
Create a SemiSupervisedGraphModel object by using fitsemigraph.
Properties
Object Functions
predict | Label new data using semi-supervised graph-based classifier |
Examples
Fit labels to unlabeled data by using a semi-supervised graph-based method.
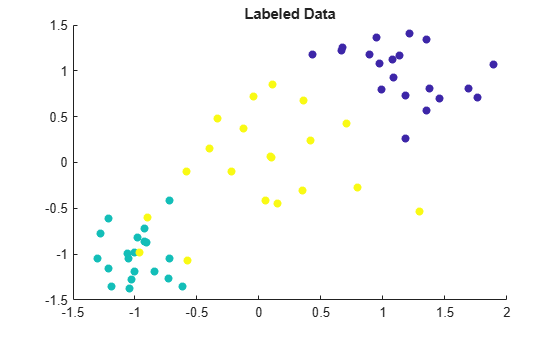
Randomly generate 60 observations of labeled data, with 20 observations in each of three classes.
rng('default') % For reproducibility

labeledX = [randn(20,2)*0.25 + ones(20,2);
            randn(20,2)*0.25 - ones(20,2);
            randn(20,2)*0.5];
Y = [ones(20,1); ones(20,1)*2; ones(20,1)*3];
Visualize the labeled data by using a scatter plot. Observations in the same class have the same color. Notice that the data is split into three clusters with very little overlap.
scatter(labeledX(:,1),labeledX(:,2),[],Y,'filled')
title('Labeled Data')
Randomly generate 300 additional observations of unlabeled data, with 100 observations per class. For the purposes of validation, keep track of the true labels for the unlabeled data.
unlabeledX = [randn(100,2)*0.25 + ones(100,2);
              randn(100,2)*0.25 - ones(100,2);
              randn(100,2)*0.5];
trueLabels = [ones(100,1); ones(100,1)*2; ones(100,1)*3];
Fit labels to the unlabeled data by using a semi-supervised graph-based method. The function fitsemigraph returns a SemiSupervisedGraphModel object whose FittedLabels property contains the fitted labels for the unlabeled data and whose LabelScores property contains the associated label scores.
Mdl = fitsemigraph(labeledX,Y,unlabeledX)
Mdl =
  SemiSupervisedGraphModel with properties:

             FittedLabels: [300×1 double]
              LabelScores: [300×3 double]
               ClassNames: [1 2 3]
             ResponseName: 'Y'
    CategoricalPredictors: []
                   Method: 'labelpropagation'


  Properties, Methods
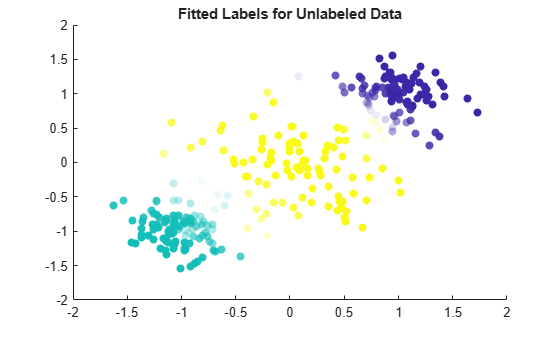
Visualize the fitted label results by using a scatter plot. Use the fitted labels to set the color of the observations, and use the maximum label scores to set the transparency of the observations. Observations with less transparency are labeled with greater confidence. Notice that observations that lie closer to the cluster boundaries are labeled with more uncertainty.
maxLabelScores = max(Mdl.LabelScores,[],2);
rescaledScores = rescale(maxLabelScores,0.05,0.95);
scatter(unlabeledX(:,1),unlabeledX(:,2),[],Mdl.FittedLabels,'filled', ...
    'MarkerFaceAlpha','flat','AlphaData',rescaledScores);
title('Fitted Labels for Unlabeled Data')
Determine the accuracy of the labeling by using the true labels for the unlabeled data.
numWrongLabels = sum(trueLabels ~= Mdl.FittedLabels)
numWrongLabels =
10
Only 10 of the 300 observations in unlabeledX are mislabeled.
Use both labeled and unlabeled data to train a SemiSupervisedGraphModel object. Label new data using the trained model.
Randomly generate 15 observations of labeled data, with 5 observations in each of three classes.
rng('default') % For reproducibility
labeledX = [randn(5,2)*0.25 + ones(5,2);
            randn(5,2)*0.25 - ones(5,2);
            randn(5,2)*0.5];
Y = [ones(5,1); ones(5,1)*2; ones(5,1)*3];
Randomly generate 300 additional observations of unlabeled data, with 100 observations per class.
unlabeledX = [randn(100,2)*0.25 + ones(100,2);
              randn(100,2)*0.25 - ones(100,2);
              randn(100,2)*0.5];
Fit labels to the unlabeled data by using a semi-supervised graph-based method. Specify label spreading as the labeling algorithm, and use an automatically selected kernel scale factor. The function fitsemigraph returns a SemiSupervisedGraphModel object whose FittedLabels property contains the fitted labels for the unlabeled data and whose LabelScores property contains the associated label scores.
Mdl = fitsemigraph(labeledX,Y,unlabeledX,'Method','labelspreading', ...
    'KernelScale','auto')
Mdl =
  SemiSupervisedGraphModel with properties:

             FittedLabels: [300×1 double]
              LabelScores: [300×3 double]
               ClassNames: [1 2 3]
             ResponseName: 'Y'
    CategoricalPredictors: []
                   Method: 'labelspreading'


  Properties, Methods
Randomly generate 150 observations of new data, with 50 observations per class. For the purposes of validation, keep track of the true labels for the new data.
newX = [randn(50,2)*0.25 + ones(50,2);
        randn(50,2)*0.25 - ones(50,2);
        randn(50,2)*0.5];
trueLabels = [ones(50,1); ones(50,1)*2; ones(50,1)*3];
Predict the labels for the new data by using the predict function of the SemiSupervisedGraphModel object. Compare the true labels to the predicted labels by using a confusion matrix.
predictedLabels = predict(Mdl,newX);
confusionchart(trueLabels,predictedLabels)
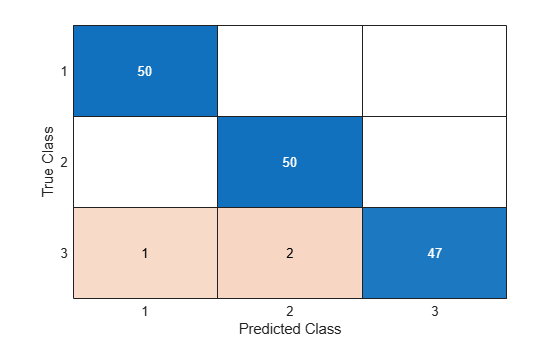
Only 3 of the 150 observations in newX are mislabeled.
Tips
You can use interpretability features, such as
lime,shapley,partialDependence, andplotPartialDependence, to interpret how predictors contribute to predictions. You must define a custom function and pass it to the interpretability functions. The custom function must return labels forlime, scores of a single class forshapley, and scores of one or more classes forpartialDependenceandplotPartialDependence. For an example, see Specify Model Using Function Handle.
Version History
Introduced in R2020b