Label Data Using Semi-Supervised Learning Techniques
This example shows how to use graph-based and self-training semi-supervised learning techniques to label data.
Semi-supervised learning combines aspects of supervised learning, where all of the training data is labeled, and unsupervised learning, where true labels are unknown. That is, some training observations are labeled, but the vast majority are unlabeled. Semi-supervised learning methods try to leverage the underlying structure of the data to fit labels to the unlabeled data.
Statistics and Machine Learning Toolbox™ provides these semi-supervised learning functions for classification:
fitsemigraphconstructs a similarity graph with labeled and unlabeled observations as nodes, and distributes label information from labeled observations to unlabeled observations.fitsemiselfiteratively trains a classifier on the data. First, the function trains a classifier on the labeled data alone, and then uses that classifier to make label predictions for the unlabeled data.fitsemiselfprovides scores for the predictions, and then treats the predictions as true labels for the next training cycle of the classifier if the scores are above a certain threshold. This process repeats until the label predictions converge.
Generate Data
Generate data from two half-moon shapes. Determine which moon new points belong to by using graph-based and self-training semi-supervised techniques.
Create the custom function twomoons (shown at the end of this example). This function takes an input argument n and creates n points in each of two interlaced half-moons: a top moon that is concave down and a bottom moon that is concave up.
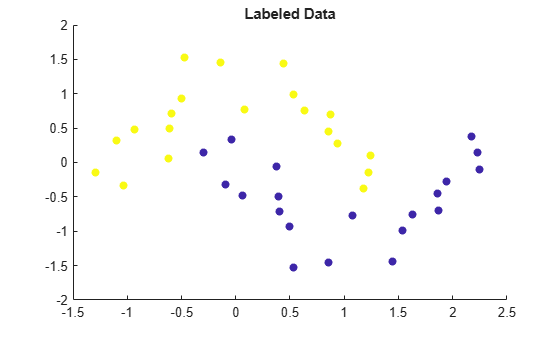
Generate a set of 40 labeled data points by using the twomoons function. Each point in X is in one of the two moons, with the corresponding moon label stored in the vector label.
rng('default') % For reproducibility
[X,label] = twomoons(20);
Visualize the points by using a scatter plot. Points in the same moon have the same color.
scatter(X(:,1),X(:,2),[],label,'filled')
title('Labeled Data')
Generate a set of 400 unlabeled data points by using the twomoons function. Each point in newX belongs to one of the two moons, but the corresponding moon label is unknown.
newX = twomoons(200);
Label Data Using Graph-Based Method
Label the unlabeled data in newX by using a semi-supervised graph-based method. By default, fitsemigraph constructs a similarity graph from the data in X and newX, and uses a label propagation technique to fit labels to newX.
graphMdl = fitsemigraph(X,label,newX)
graphMdl =
  SemiSupervisedGraphModel with properties:

             FittedLabels: [400×1 double]
              LabelScores: [400×2 double]
               ClassNames: [1 2]
             ResponseName: 'Y'
    CategoricalPredictors: []
                   Method: 'labelpropagation'


  Properties, Methods
The function returns a SemiSupervisedGraphModel object whose FittedLabels property contains the fitted labels for the unlabeled data and whose LabelScores property contains the associated label scores.
Visualize the fitted label results by using a scatter plot. Use the fitted labels to set the color of the points, and use the maximum label scores to set the transparency of the points. Points with less transparency are labeled with greater confidence.
maxGraphScores = max(graphMdl.LabelScores,[],2);
rescaledGraphScores = rescale(maxGraphScores,0.05,0.95);
scatter(newX(:,1),newX(:,2),[],graphMdl.FittedLabels,'filled', ...
    'MarkerFaceAlpha','flat','AlphaData',rescaledGraphScores);
title(["Fitted Labels for Unlabeled Data","(Graph-Based)"])
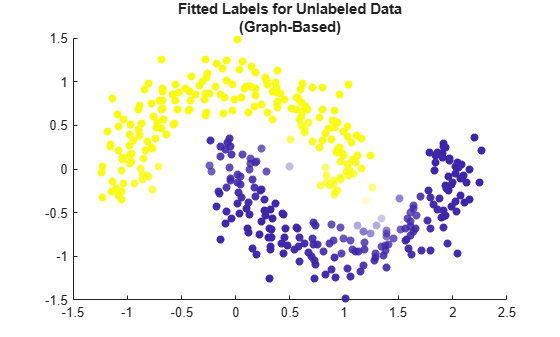
This method seems to label the newX points accurately. The two moons are visually distinct, and the points that are labeled with the most uncertainty lie on the boundary between the two shapes.
Label Data Using Self-Training Method
Label the unlabeled data in newX by using a semi-supervised self-training method. By default, fitsemiself uses a support vector machine (SVM) model with a Gaussian kernel to label the data iteratively.
selfSVMMdl = fitsemiself(X,label,newX)
selfSVMMdl =
  SemiSupervisedSelfTrainingModel with properties:

             FittedLabels: [400×1 double]
              LabelScores: [400×2 double]
               ClassNames: [1 2]
             ResponseName: 'Y'
    CategoricalPredictors: []
                  Learner: [1×1 classreg.learning.classif.CompactClassificationSVM]


  Properties, Methods
The function returns a SemiSupervisedSelfTrainingModel object whose FittedLabels property contains the fitted labels for the unlabeled data and whose LabelScores property contains the associated label scores.
Visualize the fitted label results by using a scatter plot. As before, use the fitted labels to set the color of the points, and use the maximum label scores to set the transparency of the points.
maxSVMScores = max(selfSVMMdl.LabelScores,[],2);
rescaledSVMScores = rescale(maxSVMScores,0.05,0.95);
scatter(newX(:,1),newX(:,2),[],selfSVMMdl.FittedLabels,'filled', ...
    'MarkerFaceAlpha','flat','AlphaData',rescaledSVMScores);
title(["Fitted Labels for Unlabeled Data","(Self-Training: SVM)"])
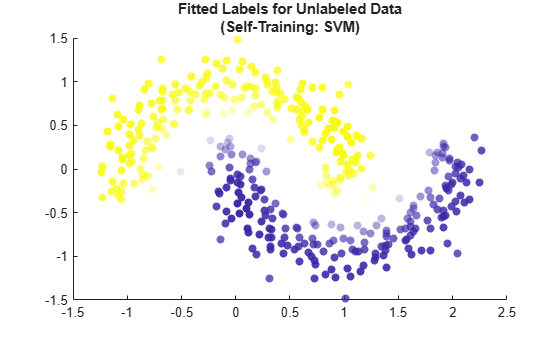
This method, with an SVM learner, also seems to label the newX points accurately. The two moons are visually distinct, and the points that are labeled with the most uncertainty lie on the boundary between the two shapes.
Some learners might not label the unlabeled data as effectively, however. For example, use a tree model instead of the default SVM model to label the data in newX.
selfTreeMdl = fitsemiself(X,label,newX,'Learner','tree');
Visualize the fitted label results.
maxTreeScores = max(selfTreeMdl.LabelScores,[],2);
rescaledTreeScores = rescale(maxTreeScores,0.05,0.95);
scatter(newX(:,1),newX(:,2),[],selfTreeMdl.FittedLabels,'filled', ...
    'MarkerFaceAlpha','flat','AlphaData',rescaledTreeScores);
title(["Fitted Labels for Unlabeled Data","(Self-Training: Tree)"])
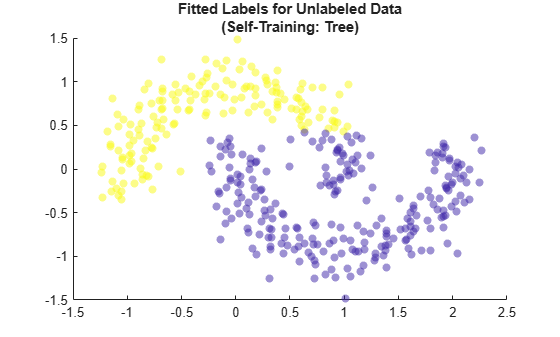
This method, with a tree learner, mislabels many of the points in the top moon. When you use a semi-supervised self-training method, make sure to use an underlying learner that is appropriate for the structure of your data.
This code creates the function twomoons.
function [X,label] = twomoons(n) % Generate two moons, with n points in each moon.

% Specify the radius and relevant angles for the two moons.
noise = (1/6).*randn(n,1);
radius = 1 + noise;
angle1 = pi + pi/10;
angle2 = pi/10;

% Create the bottom moon with a center at (1,0).
bottomTheta = linspace(-angle1,angle2,n)';
bottomX1 = radius.*cos(bottomTheta) + 1;
bottomX2 = radius.*sin(bottomTheta);

% Create the top moon with a center at (0,0).
topTheta = linspace(angle1,-angle2,n)';
topX1 = radius.*cos(topTheta);
topX2 = radius.*sin(topTheta);

% Return the moon points and their labels.
X = [bottomX1 bottomX2; topX1 topX2];
label = [ones(n,1); 2*ones(n,1)];
end