plotEmpiricalCDF
Plot empirical cumulative distribution function (ecdf) of a variable specified for data drift detection
Since R2022a
Syntax
Description
plotEmpiricalCDF( plots the
ecdf values of the baseline and target data for the continuous variable with the lowest
p-value. If the data does not contain any continuous variables, then
DDiagnostics)plotEmpiricalCDF does not generate a plot and, instead, returns a
warning.
If you set the value of EstimatePValues to
false in the call to detectdrift, then
plotEmpiricalCDF displays NaN for the
p-value and the drift status.
plotEmpiricalCDF(
plots the ecdf for the variable specified by DDiagnostics,Variable=variable)variable.
St = plotEmpiricalCDF(___)Stair objects St.
Use this to inspect and modify the properties of the object. To learn more, see Stair Properties.
Examples
Generate baseline and target data with three variables, where the distribution parameters of the second and third variables change for the target data.
rng('default') % For reproducibility
baseline = [normrnd(0,1,100,1),wblrnd(1.1,1,100,1),betarnd(1,2,100,1)];
target = [normrnd(0,1,100,1),wblrnd(1.2,2,100,1),betarnd(1.7,2.8,100,1)];
Perform permutation testing for all variables to check for any drift between the baseline and target data.
DDiagnostics = detectdrift(baseline,target)
DDiagnostics =
  DriftDiagnostics

              VariableNames: ["x1"    "x2"    "x3"]
       CategoricalVariables: []
                DriftStatus: ["Stable"    "Drift"    "Warning"]
                    PValues: [0.3850 0.0050 0.0910]
        ConfidenceIntervals: [2×3 double]
    MultipleTestDriftStatus: "Drift"
             DriftThreshold: 0.0500
           WarningThreshold: 0.1000


  Properties, Methods
Plot the ecdf for the variable with the lowest p-value.
plotEmpiricalCDF(DDiagnostics)
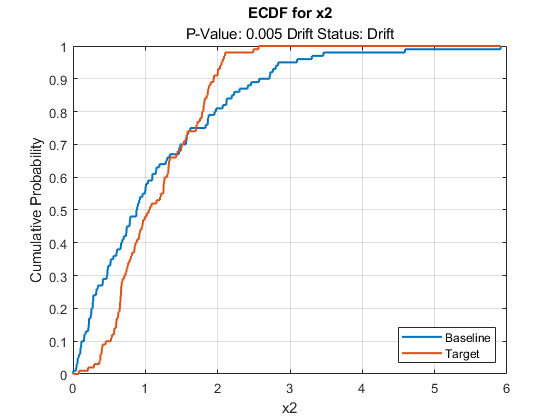
By default, plotEmpiricalCDF plots the ecdf of the baseline and target data for the variable with the lowest p-value, which is x2 in this case. You can see the difference between the two empirical cumulative distribution functions. The plot also displays the p-value and the drift status for variable x2.
Generate baseline and target data with three variables, where the distribution parameters of the second and third variables change for the target data.
rng('default') % For reproducibility
baseline = [normrnd(0,1,100,1),wblrnd(1.1,1,100,1),betarnd(1,2,100,1)];
target = [normrnd(0,1,100,1),wblrnd(1.2,2,100,1),betarnd(1.7,2.8,100,1)];
Perform permutation testing for all variables to check for any drift between the baseline and target data.
DDiagnostics = detectdrift(baseline,target)
DDiagnostics =
  DriftDiagnostics

              VariableNames: ["x1"    "x2"    "x3"]
       CategoricalVariables: []
                DriftStatus: ["Stable"    "Drift"    "Warning"]
                    PValues: [0.3850 0.0050 0.0910]
        ConfidenceIntervals: [2×3 double]
    MultipleTestDriftStatus: "Drift"
             DriftThreshold: 0.0500
           WarningThreshold: 0.1000


  Properties, Methods
Plot the ecdf for the third variable.
plotEmpiricalCDF(DDiagnostics,Variable="x3")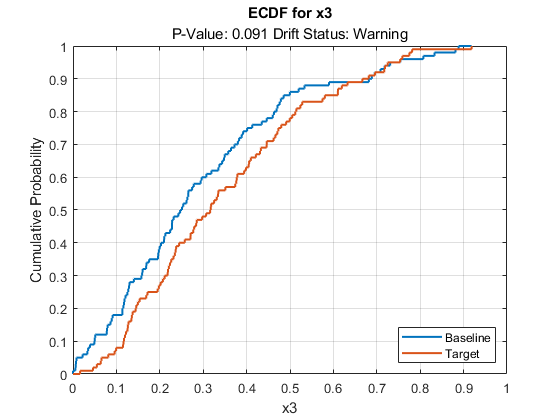
plotEmpiricalCDF plots the ecdf for the baseline and target data. The function also displays the estimated p-value and the drift status for the specified variable.
Load the sample data.
load humanactivityFor details on the data set, enter Description at the command line.
Assign the first 250 observations as baseline data and the next 250 as target data for columns 10 to 15.
baseline = feat(1:250,10:15);
target = feat(251:500,10:15);
Test for drift on all variables.
DDiagnostics = detectdrift(baseline,target)
DDiagnostics =
  DriftDiagnostics

              VariableNames: ["x1"    "x2"    "x3"    "x4"    "x5"    "x6"]
       CategoricalVariables: []
                DriftStatus: ["Drift"    "Stable"    "Stable"    "Drift"    "Stable"    "Warning"]
                    PValues: [1.0000e-03 0.5080 0.2370 1.0000e-03 0.5370 0.0820]
        ConfidenceIntervals: [2×6 double]
    MultipleTestDriftStatus: "Drift"
             DriftThreshold: 0.0500
           WarningThreshold: 0.1000


  Properties, Methods
The drift status for variables x4 and x6 is Drift and Warning, respectively. Plot the ecdf values for x4 and x6 in a tiled layout.
tiledlayout(1,2);
ax1 = nexttile;
plotEmpiricalCDF(DDiagnostics,ax1,Variable="x4")
ax2= nexttile;
plotEmpiricalCDF(DDiagnostics,ax2,Variable="x6")
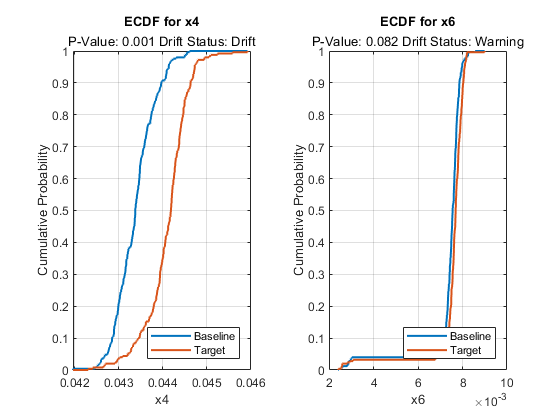
There is a greater difference between the ecdf of the baseline and target data for variable x4. The detectdrift function detects the shift for variable x4.
Input Arguments
Version History
Introduced in R2022a
See Also
detectdrift | DriftDiagnostics | plotDriftStatus | plotHistogram | plotPermutationResults | ecdf | summary | histcounts