detectdrift
Detect drifts between baseline and target data using permutation testing
Syntax
Description
performs Permutation Testing to detect drift for each
variable in the DDiagnostics
= detectdrift(Baseline
,Target
)Baseline
and Target
data sets and
returns the results in DDiagnostics
.
DDiagnostics
is a DriftDiagnostics
object.
specifies additional options using one or more of the name-value arguments. For example, you
can specify the metrics to use for the variables or the maximum number of
permutations.DDiagnostics
= detectdrift(Baseline
,Target
,Name=Value
)
Examples
Compare Baseline and Target Data for Potential Drift
Generate baseline and target data with two variables, where the distribution parameters of the second variable change for target data.
rng('default') % For reproducibility baseline = [normrnd(0,1,100,1),wblrnd(1.1,1,100,1)]; target = [normrnd(0,1,100,1),wblrnd(1.2,2,100,1)];
Compare the two data sets for any drift.
DDiagnostics = detectdrift(baseline,target)
DDiagnostics = DriftDiagnostics VariableNames: ["x1" "x2"] CategoricalVariables: [] DriftStatus: ["Stable" "Drift"] PValues: [0.2850 0.0030] ConfidenceIntervals: [2x2 double] MultipleTestDriftStatus: "Drift" DriftThreshold: 0.0500 WarningThreshold: 0.1000 Properties, Methods
DDiagnostics is a DriftDiagnostics
object. detectdrift
displays some of the object properties.
You can further display the confidence intervals for the estimated p-values.
DDiagnostics.ConfidenceIntervals
ans = 2×2
0.2572 0.0006
0.3141 0.0087
The lower bound of the confidence interval for the estimated p-value for the first variable is greater than the warning threshold value of 0.1. Hence, detectdrift
concludes the target data for the first variable is stable compared to the baseline data. The upper bound of the confidence interval for the estimated p-value for the second variable is smaller than the drift threshold of 0.05, so the drift status for this variable is drift. detectdrift
detects the shift in the distribution parameters.
detectdrift
uses the default Bonferroni method for testing multiple hypotheses. It first divides the warning and drift thresholds by the number of p-values, which in this case is two. Then it checks any of the p-values are still lower than any of the thresholds. You can see that the second p-value is still lower than the modified drift threshold, so the software sets the MultipleTestDriftStatus
to drift for overall data.
Visualize the permutation results for both variables.
tiledlayout(1,2); ax1 = nexttile; plotPermutationResults(DDiagnostics,ax1,Variable="x1") ax2 = nexttile; plotPermutationResults(DDiagnostics,ax2,Variable="x2")
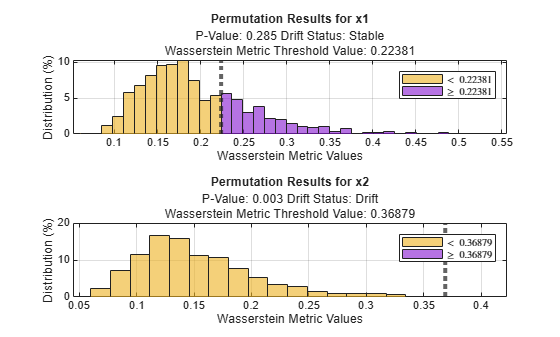
Bars to the right of the dashed line show the metric values that are greater than the threshold, which is the initial metric value detectdrift
computes using the baseline and target data for each variable. The amount of the bars greater than the threshold is much more for variable x1
, which indicates that there is not a significant drift between baseline and target data for that variable.
Specify Options for Batch Drift Detection
Load the sample data.
load humanactivity
For details on the data set, enter Description
at the command line. Assign the first 250 observations as baseline data and next 250 as target data.
baseline = feat(1:250,:); target = feat(251:500,:);
Test for drift on variables 5 to 10 using a warning threshold of 0.05 and a drift threshold of 0.01. All variables are continuous, so use the Kolmogorov-Smirnov metric for all variables. Use the False Discovery Rate method as the multiple test correction.
DDiagnostics = detectdrift(baseline(:,5:10),target(:,5:10),WarningThreshold=0.05, ... DriftThreshold=0.01,ContinuousMetric="ks",MultipleTestCorrection="fdr")
DDiagnostics = DriftDiagnostics VariableNames: ["x1" "x2" "x3" "x4" "x5" "x6"] CategoricalVariables: [] DriftStatus: ["Drift" "Drift" "Drift" ... ] PValues: [1.0000e-03 1.0000e-03 1.0000e-03 0.8810 ... ] ConfidenceIntervals: [2x6 double] MultipleTestDriftStatus: "Drift" DriftThreshold: 0.0100 WarningThreshold: 0.0500 Properties, Methods
Display the confidence intervals for p-value estimates.
DDiagnostics.ConfidenceIntervals
ans = 2×6
0.0000 0.0000 0.0000 0.8593 0.0055 0.0000
0.0056 0.0056 0.0056 0.9004 0.0196 0.0056
The lower confidence bound of the p-value for the 8th variable (corresponding variable name x4
) is greater than the warning threshold, hence detectdrift
decides the drift status for this variable is Stable
. The upper confidence bound of the p-value for the 9th variable (corresponding variable name x5
) is greater than the drift threshold, but lower than the warning threshold. Hence, detectdrift
decides the drift status for this variable is Warning
. Confidence intervals of all other variables are smaller than the drift threshold, so their drift statuses are Drift
. Based on the False Discovery Rate method for multiple test correction, the software decides the drift status for overall data is Drift
.
Visualize the p-values with the confidence intervals and corresponding drift status.
plotDriftStatus(DDiagnostics)
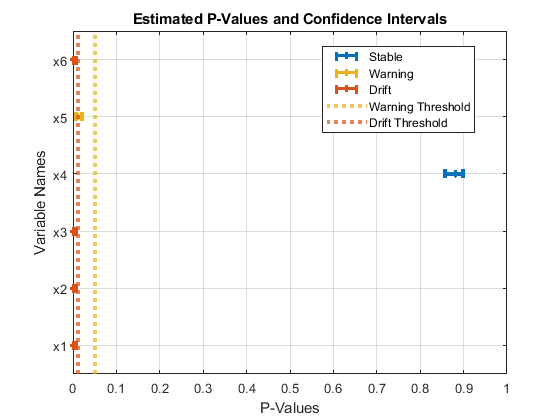
Specify Variables and Metrics to Use in Drift Detection
Load the data set NYCHousing2015.
load NYCHousing2015
The data set includes 10 variables with information on the sales of properties in New York City in 2015.
Remove outliers, convert the datetime
array (SALEDATE
) to the month numbers.
idx = isoutlier(NYCHousing2015.SALEPRICE); NYCHousing2015(idx,:) = []; NYCHousing2015.SALEDATE = month(NYCHousing2015.SALEDATE);
Define baseline and target data as information on the sales made in the months January and July, respectively.
tbl = NYCHousing2015; baseline = tbl(tbl.SALEDATE==1,:); target = tbl(tbl.SALEDATE==7,:);
Shuffle data.
n = numel(baseline(:,1));
rng(1); % For reproducibility
idx = randsample(n,n);
baseline = baseline(idx,:);
n = numel(target(:,1));
idx = randsample(n,n);
target = target(idx,:);
Test for potential drift between the baseline and target data. Specify the categorical variables and the metrics to use with each variable.
DDiagnostics = detectdrift(baseline(1:1500,:),target(1:1500,:), ... VariableNames=["BOROUGH","BUILDINGCLASSCATEGORY","LANDSQUAREFEET","GROSSSQUAREFEET","SALEPRICE"], ... CategoricalVariables=["BOROUGH","BUILDINGCLASSCATEGORY"], ... Metrics=["Hellinger","Hellinger","ad","ks","energy"])
DDiagnostics = DriftDiagnostics VariableNames: ["BOROUGH" "BUILDINGCLASSCATEGORY" ... ] CategoricalVariables: [1 2] DriftStatus: ["Drift" "Stable" "Drift" ... ] PValues: [0.0260 0.1440 0.0070 0.0230 0.0110] ConfidenceIntervals: [2x5 double] MultipleTestDriftStatus: "Drift" DriftThreshold: 0.0500 WarningThreshold: 0.1000 Properties, Methods
detectdrift
identifies drift between the baseline and target data for all variables, but BUILDINGCLASSCATEGORY
.
Display the confidence intervals for the estimated p-values.
DDiagnostics.ConfidenceIntervals
ans = 2×5
0.0171 0.1228 0.0028 0.0146 0.0055
0.0379 0.1673 0.0144 0.0343 0.0196
Plot histogram for SALEPRICE
.
plotHistogram(DDiagnostics,Variable="SALEPRICE")
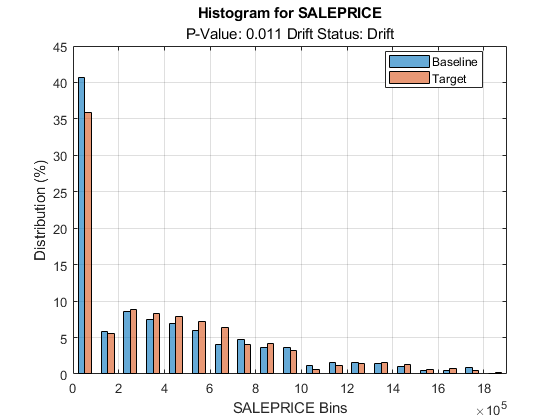
Histogram shows the shift in the sale prices for the month of July compared to January.
Plot the empirical cumulative distribution function for baseline and target data of SALEPRICE
.
plotEmpiricalCDF(DDiagnostics,Variable="SALEPRICE")
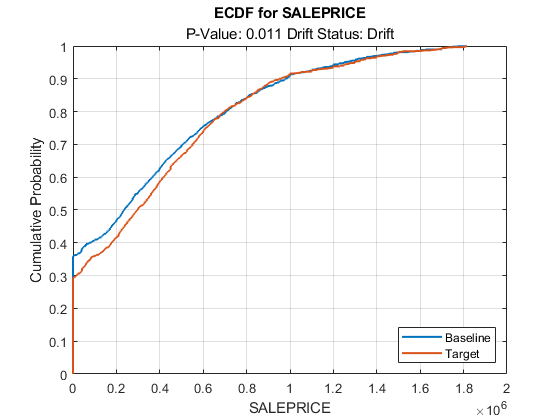
Plot the permutation results for SALEPRICE
.
plotPermutationResults(DDiagnostics,Variable="SALEPRICE")
Compute Metrics without Estimating p-Values
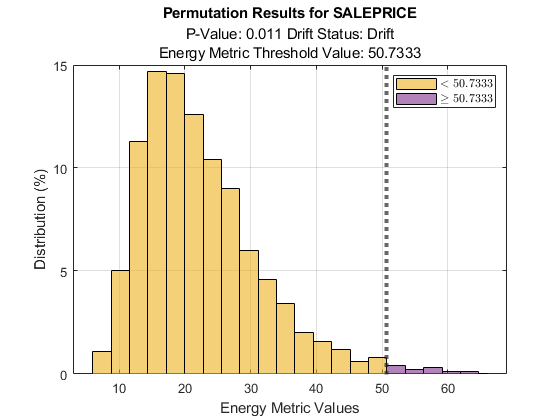
Generate baseline and target data with three variables, where the distribution parameters of the second and third variables change for target data.
rng('default') % For reproducibility baseline = [normrnd(0,1,100,1),wblrnd(1.1,1,100,1),betarnd(1,2,100,1)]; target = [normrnd(0,1,100,1),wblrnd(1.2,2,100,1),betarnd(1.7,2.8,100,1)];
Compute the initial metrics for all variables between the baseline and target data without estimating p-values.
DDiagnostics = detectdrift(baseline,target,EstimatePValues=false)
DDiagnostics = DriftDiagnostics VariableNames: ["x1" "x2" "x3"] CategoricalVariables: [] Metrics: ["Wasserstein" "Wasserstein" "Wasserstein"] MetricValues: [0.2022 0.3468 0.0559] Properties, Methods
detectdrift
only computes the initial metrics value for each variable using the baseline and target data. The properties associated with permutation testing and p-value estimation are either empty or contain NaN
s.
summary(DDiagnostics)
MetricValue Metric ___________ _____________ x1 0.20215 "Wasserstein" x2 0.34676 "Wasserstein" x3 0.055922 "Wasserstein"
summary
method only displays the metrics used and the initial metric value for each of the specified variables.
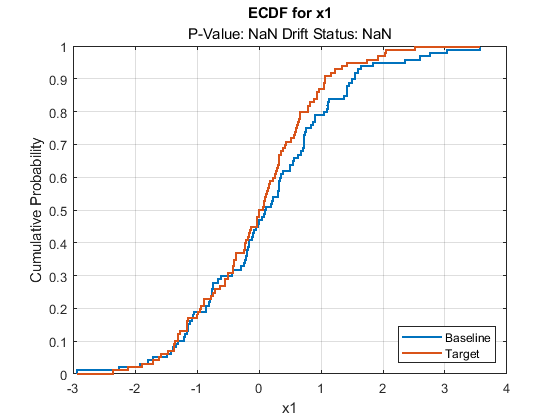
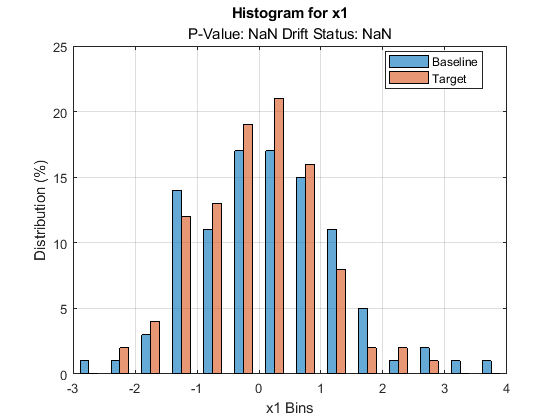
plotDriftStatus
and plotPermutationResults
do not produce plots and return warning messages. plotEmpiricalCDF
and plotHistogram
plot the ecdf and the histogram, respectively, for the first variable by default. They both return NaN
for the p-value and drift status associated with the variable.
plotEmpiricalCDF(DDiagnostics)
plotHistogram(DDiagnostics)
Input Arguments
Baseline
— Baseline data
numeric array | categorical array | table
Baseline data, specified as a numeric array, categorical array, or table.
Baseline
and Target
data must have the same
data type. When the input data is a categorical array, detectdrift
treats each column as an independent categorical variable.
Data Types: single
| double
| categorical
| table
Target
— Target data
numeric array | categorical array | table
Target data, specified as a numeric array, categorical array, or table.
Baseline
and Target
data must have the same
data type. When the input data is a categorical array, detectdrift
treats each column as an independent categorical variable.
Data Types: single
| double
| categorical
| table
Name-Value Arguments
Specify optional pairs of arguments as
Name1=Value1,...,NameN=ValueN
, where Name
is
the argument name and Value
is the corresponding value.
Name-value arguments must appear after other arguments, but the order of the
pairs does not matter.
Example: detectdrift(Baseline,Target,WarningThreshold=0.05,DriftThreshold=0.01,VariableNames=[''Weight'',''MPG''],ContinuousMetrics=''ad'')
sets the warning threshold to 0.05 and drift threshold to 0.01, specifies Weight and MPG as
the variables to test for drift detection, and Anderson-Darling as the metric to use in
testing all continuous variables.
VariableNames
— Variables to analyze for drift
string | array of unique strings | character vector | cell array of character vectors
Variables to analyze for drift, specified as a string, array of unique strings, character vector, or cell array of character vectors.
Example: VariableNames=["x1","x3"]
Data Types: string
| char
| cell
CategoricalVariables
— List of categorical variables
"all"
| string | array of unique strings | character vector | cell array of unique character vectors | vector of integer indices | vector of logical indices
List of categorical variables, specified as "all"
, a string,
array of unique strings, character vector, cell array of unique character vectors,
vector of integer indices, or vector of logical indices.
detectdrift
treats the following as categorical variables:
ordinal
or nominal
data types, or the
categorical
data type with the ordinal indicator set to true as
categorical variables.
Example: CategoricalVariables="Zone"
Data Types: single
| double
| logical
| string
| cell
DriftThreshold
— Threshold for detecting drift
0.05 (default) | scalar value from 0 to 1
Threshold for detecting drift, specified as a scalar value from 0 to 1.
detectdrift
uses the drift threshold together with warning
threshold to determine the drift status. The DriftThreshold
value
must be strictly lower than WarningThreshold
value.
If the confidence interval for an estimated p-value is
(Lower,Upper), then
detectdrift
determines the drift status as follows.
Drift Status | Condition |
---|---|
Drift | Upper < DriftThreshold |
Warning | DriftThreshold < Lower <
WarningThreshold or DriftThreshold
< Upper <
WarningThreshold |
Stable | Lower > WarningThreshold |
Example: DriftThreshold=0.01
Data Types: single
| double
WarningThreshold
— Threshold for potential drift warning
0.1 (default) | scalar value between 0 and 1
Threshold for potential drift warning, specified as a scalar value between 0 and 1.
detectdrift
uses the warning threshold together with drift
threshold to determine the drift status. WarningThreshold
value
must be strictly greater than DriftThreshold
value.
If the confidence interval for an estimated p-value is
(Lower,Upper), then
detectdrift
determines the drift status as follows.
Drift Status | Condition |
---|---|
Drift | Upper < DriftThreshold |
Warning | DriftThreshold < Lower <
WarningThreshold or DriftThreshold
< Upper <
WarningThreshold |
Stable | Lower > WarningThreshold |
Example: WarningThreshold=0.05
Data Types: single
| double
MaxNumPermutations
— Maximum number of permutations
1000 (default) | positive integer value
Maximum number of permutations, specified as a positive integer value.
detectdrift
increases the number of trials for permutation
logarithmically according to a heuristic algorithm until it determines the drift
status or reaches MaxNumPermutations
. If
detectdrift
cannot determine the drift status by the end of the
maximum number of permutations, then it sets the drift status to
"Warning"
.
Example: MaxNumPermutations=1500
Data Types: single
| double
Metrics
— Metrics to use for each variable for detecting drift
string | string vector | character vector | cell array of character vectors | function handle | cell array of function handles | structure
Metrics used to detect drift for each variable, specified as one of the following:
String, string vector, character vector, or cell array of character vectors representing one or more of the built-in metrics.
Built-in metrics for continuous variables
Value Definition ''wasserstein''
Wasserstein ''energy''
Energy ''ks''
Kolmogorov-Smirnov ''ad''
Anderson-Darling Built-in metrics for categorical variables
Value Definition ''tv''
Total Variation ''psi''
Population Stability Index ''hellinger''
Hellinger ''chi2''
Chi-Square ''bhattacharyya''
Bhattarcharyya Function handle or a cell array of function handles. If you provide a function handle
FUN
as a metric, it is called as follows:FUN(BaselineVariable,TargetVariable)
,where
BaselineVariable
is the variable inBaseline
andTargetVariable
is the variable inTarget
. Output ofFUN
must be a scalar representing the metric value.Structure or a cell array of structures, where each structure has a single field and its value is a function handle. If you pass a structure,
detectdrift
uses the field name as the metric name. If the function handle is anonymous,detectdrift
names it as'CustomMetric_i'
, where i is the position in theMetrics
value.
Metrics
must have one value for each variable
specified for drift detection using VariableNames
and its size
must be equal to the size of VariableNames
.
If you specify metrics using Metrics
, you cannot specify
them using either ContinuousMetric
or
CategoricalMetric
.
Example: Metrics=[''wasserstein'',''psi'',''hellinger'']
Data Types: string
| cell
| function_handle
| struct
ContinuousMetric
— Metric for drift detection in continuous variables
''wasserstein''
(default) | string | character vector | function handle | structure
Metric for drift detection in continuous variables, specified as one of the following:
String or a character vector representing one or more of the built-in metrics.
Built-in metrics for continuous variables
Value Definition ''wasserstein''
Wasserstein ''energy''
Energy ''ks''
Kolmogorov-Smirnov ''ad''
Anderson-Darling Function handle called as follows:
FUN(BaselineVariable,TargetVariable)
,where
BaselineVariable
is the variable inBaseline
andTargetVariable
is the variable inTarget
. Output ofFUN
must be a scalar representing the metric value.If the function handle is not anonymous,
detectdrift
extracts the metric name from the provided function handle. If it is an anonymous function handle, then it names the metric'CustomContinuousMetric'
.Structure with a single field whose value is a function handle. In this case,
detectdrift
uses the field name as the metric name.
If you specify ContinuousMetric
, then you cannot
specify any other metrics using Metrics
.
Example: ContinuousMetric=''ks''
Data Types: string
| char
| function_handle
| struct
CategoricalMetric
— Metric for drift detection in categorical variables
"hellinger"
(default) | string | character vector | function handle | structure
Metric for drift detection in categorical variables, specified as one of the following.
String or a character vector representing one or more of the built-in metrics.
Built-in metrics for categorical variables
Value Definition ''tv''
Total Variation ''psi''
Population Stability Index ''hellinger''
Hellinger ''chi2''
Chi-Square ''bhattacharyya''
Bhattarcharyya Function handle called as follows:
FUN(BaselineVariable,TargetVariable)
,where
BaselineVariable
is the variable inBaseline
andTargetVariable
is the variable inTarget
. Output ofFUN
must be a scalar representing the metric value.If the function handle is not anonymous,
detectdrift
extracts the metric name from the provided function handle. If it is an anonymous function handle, then it names the metric'CustomCategoricalMetric'
.Structure with a single field whose value is a function handle. In this case,
detectdrift
uses the field name as the metric name.
If you specify CategoricalMetric
, then you cannot
specify any other arguments using Metrics
.
Example: CategoricalMetric="chi2"
Data Types: string
| char
| function_handle
| struct
MultipleTestCorrection
— Correction method for multiple hypothesis tests
"bonferroni"
(default) | "fdr"
Correction method for multiple hypothesis tests, specified as one of the following.
"bonferroni"
- Bonferroni correction. If there are k variables specified for drift detection,detectdrift
modifies the warning threshold and drift threshold by dividing them with k. Then, it checks if any of the p-values are smaller than the modified threshold values to decide the drift status."fdr"
- False discovery rate (FDR) method.detectdrift
uses the Benjamini-Hochberg procedure to compute the false discovery rate. If there are k variables specified for drift detection, the method works in the following way:Ranks the p-values corresponding to these variables.
Divides the ranks 1 to k by the number of variables k to obtain Q = [1/k, 2/k, 3/k ,…,k/k].
Modifies the warning and drift thresholds for each sorted p-value by multiplying the initial warning and drift threshold values with the corresponding q value; for example, modified warning threshold for rank 3 is (WarningThreshold)*3/k.
Checks if any of the sorted p-values is smaller than the corresponding modified warning or drift thresholds to decide on the drift status.
The multiple test correction methods provide a conservative estimate of the multivariable drift.
Example: MultipleTestCorrection="fdr"
UseParallel
— Flag to run in parallel
false
(default) | true
Flag to run in parallel, specified as true
or
false
. If you specify UseParallel=true
, the
detectdrift
function executes for-loop iterations in parallel
by using parfor
. This option requires
Parallel Computing Toolbox™
Example: UseParallel=true
EstimatePValues
— Indicator to estimate p-values
true
(default) | false
Indicator to estimate the p-values during permutation testing,
specified as either true
or false
. If you
EstimatePValues
as false
, then
detectdrift
only computes the metrics.
Example: EstimatePValues=false
Output Arguments
DDiagnostics
— Results of permutation testing for drift detection
DriftDiagnostics
object
Results of permutation testing for drift detection, specified as a
DriftDiagnostics
object. detectdrift
displays
the following properties.
Property Name | Description |
---|---|
VariableNames | Variables analyzed for drift detection |
CategoricalVariables | Indices of categorical variables in the data |
DriftStatus | Drift status for each variable |
PValues | Estimated p-value for each variable |
ConfidenceIntervals | 95% confidence interval bounds for the estimated p-values |
MultipleTestDriftStatus | Drift status for the overall data |
DriftThreshold | Threshold to determine the drift status |
WarningThreshold | Threshold to determine the warning status |
For a full list of the properties and their descriptions, see the DriftDiagnostics
reference page.
Algorithms
Permutation Testing
detectdrift
uses permutation testing to determine drift status for
each variable in the Baseline
data and its counterpart in the
Target
data. A permutation test is a nonparametric statistical
significance test in which the distribution of a metric (test statistic) under the null
hypothesis is obtained by computing the values of that metric under all possible
rearrangements of a variable in Baseline
and
Target
. Depending on the number of variables and observations, trying
all possible permutations of a variable might be infeasible, hence
detectdrift
performs sufficiently many permutations to obtain a good
estimate of the metric for the variable under consideration.
Under null hypothesis, i.e. no drift, many values of the metric recorded during
permutation testing will be as extreme as or more extreme than the initial test statistic.
If this is the case, it implies that with sufficiently high confidence, the observations of
the specified variable in baseline data and in target data come from the same distribution.
Hence no evidence of drift is found and detectdrift
fails to reject the
null hypothesis.
If the initial test statistic is identified as an outlier, then null hypothesis is rejected. This implies that with sufficiently high confidence, the observations of the specified variable in baseline data and in target data come from different distributions. Hence, drift is detected.
These are the steps that detectdrift
takes in permutation
testing:
For a given variable with m observations in baseline data and n observations in target data,
detectdrift
computes an initial value of the metric from the original data.It then permutes the observations of the variable in baseline data and target data and separates them into two vectors with sizes m and n, respectively. Next, it computes the same metric value.
detectdrift
repeats this forMaxNumPermutations
times to get a distribution of the specified metric.An estimate of the p-value is p = x/perm, where x is the number of times a metric value obtained from a permutation is greater than the value of the initial metric value, and perm is the number of permutations. With the Binomial distribution assumption for x,
detectdrift
estimates the 95% confidence interval for the p-value by using[~,CI] = binofit(x,perm,0.05)
.
Given the confidence intervals (Lower, Upper) of
the p-values, detectdrift
decides on the drift
status based on the following conditions:
Drift Status | Condition |
---|---|
Drift | Upper < DriftThreshold |
Warning | DriftThreshold < Lower <
WarningThreshold or DriftThreshold
< Upper < WarningThreshold |
Stable | Lower > WarningThreshold |
Metrics
detectdrift
uses the following metrics as test statistics in
permutation testing for detecting drift between baseline and target data.
After defining as the empirical cumulative distribution function (ecdf) of the baseline
data over the common domain, as the ecdf of the target data over the common domain, as the joint ecdf of all data, and w as the
difference between the edges of the bins, detectdrift
computes the
metrics for continuous variables as follows.
Wasserstein
Energy
Kolmogorov-Smirnov
Anderson-Darling
m and n are the number of observations in baseline data and target data, respectively.
After defining as the percentage of the baseline data in the bins determined by
combining the baseline and target data (jointly considering them across the same domain)
and as the percentage of the baseline data in the bins determined by
combining the baseline and target data, detectdrift
computes the
metrics for categorical variables in the following way.
Note that, for categorical data, detectdrift
adds 0.5 correction
factor to histogram bin counts for each bin to handle empty bins (categories). This is
equivalent to the assumption that the parameter p, probability that
value of the variable would be in that category, has the prior distribution Beta(0.5,0.5),
i.e. Jefferys prior assumption for the distribution parameter.
Total Variation
Population Stability Index
Chi-Square
Bhattarcharyya
Hellinger
References
[1] Benjamini, Yoav, and Yosef Hochberg. "Controlling the False Discovery Rate: A Practical and Powerful Approach to Multiple Testing." Journal of the Royal Statistical Society, Series B (Methodological). Vol. 57, No. 1, pp. 289-300, 1995.
[2] Villani, Cédric. Topics in Optimal Transportation. Graduate Studies in Mathematics. Vol. 58, American Mathematical Society, 2000.
[3] Deza, Elena, and Michel Marie Deza. Encyclopedia of Distances, Springer Berlin Heidelberg, 2009.
Extended Capabilities
Automatic Parallel Support
Accelerate code by automatically running computation in parallel using Parallel Computing Toolbox™.
To run in parallel, set the UseParallel
name-value argument to
true
in the call to this function.
For more general information about parallel computing, see Run MATLAB Functions with Automatic Parallel Support (Parallel Computing Toolbox).
Version History
See Also
DriftDiagnostics
| ecdf
| histcounts
| plotDriftStatus
| plotEmpiricalCDF
| plotHistogram
| plotPermutationResults
| summary
Open Example
You have a modified version of this example. Do you want to open this example with your edits?
MATLAB Command
You clicked a link that corresponds to this MATLAB command:
Run the command by entering it in the MATLAB Command Window. Web browsers do not support MATLAB commands.
Select a Web Site
Choose a web site to get translated content where available and see local events and offers. Based on your location, we recommend that you select: .
You can also select a web site from the following list:
How to Get Best Site Performance
Select the China site (in Chinese or English) for best site performance. Other MathWorks country sites are not optimized for visits from your location.
Americas
- América Latina (Español)
- Canada (English)
- United States (English)
Europe
- Belgium (English)
- Denmark (English)
- Deutschland (Deutsch)
- España (Español)
- Finland (English)
- France (Français)
- Ireland (English)
- Italia (Italiano)
- Luxembourg (English)
- Netherlands (English)
- Norway (English)
- Österreich (Deutsch)
- Portugal (English)
- Sweden (English)
- Switzerland
- United Kingdom (English)