plotDriftStatus
Plot p-values and confidence intervals for variables tested for data drift
Since R2022a
Syntax
Description
plotDriftStatus( plots the
estimated p-value of the permutation test for each variable specified
for drift detection in the call to DDiagnostics)detectdrift, as well as the
confidence interval for each estimated p-value, using error bars. The
function also plots the warning and drift thresholds as well and color-codes the
p-values with their confidence intervals according to their drift
status.
If you set the value of EstimatePValues to
false in the call to detectdrift, then
plotDriftStatus does not generate a plot and, instead, returns a
warning.
plotDriftStatus(
plots the drift status for the variables specified by
DDiagnostics,Variables=variables)variables.
plotDriftStatus( plots on
the axes ax,___)ax instead of gca, using any of the input
argument combinations in the previous syntaxes.
EB = plotDriftStatus(___)ErrorBar objects
EB. Use EB to inspect and modify the
properties of the error bars. To learn more, see ErrorBar Properties.
[
additionally returns an array of EB,CL] = plotDriftStatus(___)ConstantLine objects
CL for the drift and warning threshold values.
CL is an array of ConstantLine objects. Use
CL to inspect and modify the properties of the lines. For more
information, see ConstantLine Properties.
Examples
Generate baseline and target data with three variables, where the distribution parameters of the second and third variables change for target data.
rng('default') % For reproducibility
baseline = [normrnd(0,1,100,1),wblrnd(1.1,1,100,1),betarnd(1,2,100,1)];
target = [normrnd(0,1,100,1),wblrnd(1.2,2,100,1),betarnd(1.7,2.8,100,1)];
Perform permutation testing for all variables to check for any drift between the baseline and target data.
DDiagnostics = detectdrift(baseline,target)
DDiagnostics =
  DriftDiagnostics

              VariableNames: ["x1"    "x2"    "x3"]
       CategoricalVariables: []
                DriftStatus: ["Stable"    "Drift"    "Warning"]
                    PValues: [0.3850 0.0050 0.0910]
        ConfidenceIntervals: [2×3 double]
    MultipleTestDriftStatus: "Drift"
             DriftThreshold: 0.0500
           WarningThreshold: 0.1000


  Properties, Methods
Display the 95% confidence intervals for the estimated p-values.
DDiagnostics.ConfidenceIntervals
ans = 2×3

    0.3547    0.0016    0.0739
    0.4160    0.0116    0.1106
Plot the drift status for all three variables.
plotDriftStatus(DDiagnostics)
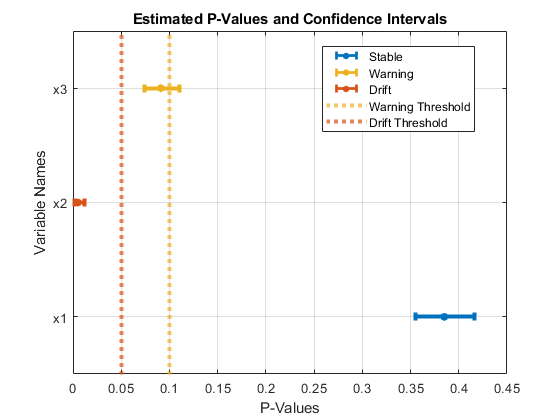
plotDriftStatus plots the confidence intervals for the estimated p-values, using error bars. The function also compares the confidence bounds against the drift and warning thresholds, and indicates the drift status of each variable using different colors. The lower confidence bound of the p-value for the first variable is higher than the warning threshold. Therefore, the drift status for the first variable is Stable, indicated by the color blue. The lower confidence bound of the p-value for the third variable is lower than the warning threshold, but higher than the drift threshold. Therefore, the drift status for the third variable is Warning, and is indicated by the color yellow. The upper confidence bound of the p-value for the second variable is lower than the drift threshold. Therefore, the drift status for the third variable is Drift and is indicated by the color orange.
Load the sample data.
load humanactivityFor details on the data set, enter Description at the command line.
Assign the first 250 observations as baseline data and the next 250 as target data for the first 15 variables.
baseline = feat(1:250,1:15);
target = feat(251:500,1:15);
Test for drift on all variables.
DDiagnostics = detectdrift(baseline,target)
DDiagnostics =
  DriftDiagnostics

              VariableNames: ["x1"    "x2"    "x3"    "x4"    "x5"    "x6"    "x7"    "x8"    "x9"    "x10"    "x11"    "x12"    "x13"    "x14"    "x15"]
       CategoricalVariables: []
                DriftStatus: ["Drift"    "Drift"    "Drift"    "Drift"    "Drift"    "Drift"    "Drift"    "Stable"    "Stable"    "Drift"    "Stable"    "Stable"    "Drift"    "Stable"    "Warning"]
                    PValues: [1.0000e-03 1.0000e-03 1.0000e-03 1.0000e-03 1.0000e-03 1.0000e-03 1.0000e-03 0.8630 0.7260 1.0000e-03 0.4960 0.2490 1.0000e-03 0.5740 0.0940]
        ConfidenceIntervals: [2×15 double]
    MultipleTestDriftStatus: "Drift"
             DriftThreshold: 0.0500
           WarningThreshold: 0.1000


  Properties, Methods
Display the 95% confidence intervals of the p-values for variables 10 to 15.
DDiagnostics.ConfidenceIntervals(:,10:15)
ans = 2×6

    0.0000    0.4646    0.2225    0.0000    0.5427    0.0766
    0.0056    0.5275    0.2770    0.0056    0.6049    0.1138
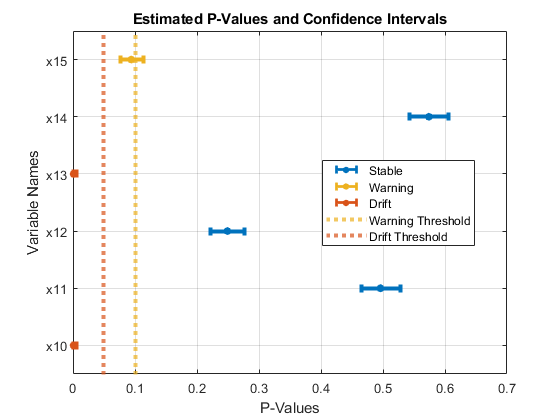
Plot the drift status for variables 10 to 15.
plotDriftStatus(DDiagnostics,Variables=(10:15))
Load the sample data.
load humanactivityFor details on the data set, enter Description at the command line.
Assign the first 250 observations as baseline data and the next 250 as target data for the first 15 variables.
baseline = feat(1:250,1:15);
target = feat(251:500,1:15);
Test for drift on all variables.
DDiagnostics = detectdrift(baseline,target);
Plot the drift status for all variables and return the ErrorBar and ConstantLine objects.
[EB,CL] = plotDriftStatus(DDiagnostics)

EB =
  3×1 ErrorBar array:

  ErrorBar    (Stable)
  ErrorBar    (Warning)
  ErrorBar    (Drift)
CL =
  2×1 ConstantLine array:

  ConstantLine
  ConstantLine
EB is an array of ErrorBar objects and CL is an array of ConstantLine objects. You can change the appearance of the plot by accessing the properties of these objects. Change the color of the error bars and markers for status Stable to green. Change the color of the drift threshold line, error bars, and markers for the status Drift to magenta.
EB(1).Color = [0 1 0];
EB(1).MarkerFaceColor = [0 1 0];
EB(1).MarkerEdgeColor = [0 1 0];
EB(3).Color = [1 0 1];
EB(3).MarkerFaceColor = [1 0 1];
EB(3).MarkerEdgeColor = [1 0 1];
CL(2).Color = [1 0 1];

You can also access and modify properties by double-clicking EB or CL in the Workspace to open and use the Property Inspector.
Input Arguments
Output Arguments
Version History
Introduced in R2022a
See Also
detectdrift | DriftDiagnostics | plotEmpiricalCDF | plotHistogram | plotPermutationResults | ecdf | summary | histcounts