kfoldMargin
Classification margins for cross-validated kernel classification model
Description
margin = kfoldMargin(CVMdl)ClassificationPartitionedKernel) CVMdl. For every fold,
kfoldMargin computes the classification margins for validation-fold
observations using a model trained on training-fold observations.
Examples
Load the ionosphere data set. This data set has 34 predictors and 351 binary responses for radar returns, which are labeled as either bad ('b') or good ('g').
load ionosphereCross-validate a binary kernel classification model using the data.
CVMdl = fitckernel(X,Y,'Crossval','on')
CVMdl =
  ClassificationPartitionedKernel
    CrossValidatedModel: 'Kernel'
           ResponseName: 'Y'
        NumObservations: 351
                  KFold: 10
              Partition: [1×1 cvpartition]
             ClassNames: {'b'  'g'}
         ScoreTransform: 'none'


  Properties, Methods
CVMdl is a ClassificationPartitionedKernel model. By default, the software implements 10-fold cross-validation. To specify a different number of folds, use the 'KFold' name-value pair argument instead of 'Crossval'.
Estimate the classification margins for validation-fold observations.
m = kfoldMargin(CVMdl);
size(m)
ans = 1×2

   351     1
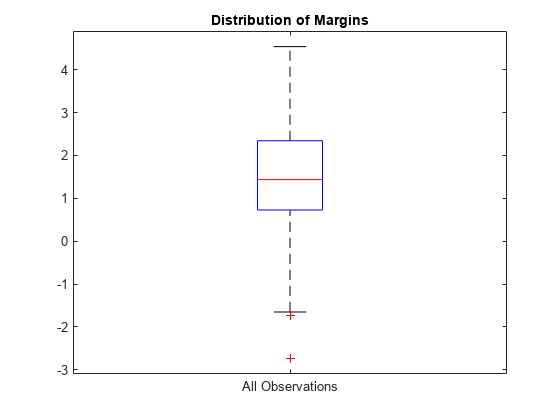
m is a 351-by-1 vector. m(j) is the classification margin for observation j.
Plot the k-fold margins using a box plot.
boxplot(m,'Labels','All Observations')
title('Distribution of Margins')
Perform feature selection by comparing k-fold margins from multiple models. Based solely on this criterion, the classifier with the greatest margins is the best classifier.
Load the ionosphere data set. This data set has 34 predictors and 351 binary responses for radar returns, which are labeled either bad ('b') or good ('g').
load ionosphereRandomly choose 10% of the predictor variables.
rng(1); % For reproducibility
p = size(X,2); % Number of predictors
idxPart = randsample(p,ceil(0.1*p));
Cross-validate two binary kernel classification models: one that uses all of the predictors, and one that uses 10% of the predictors.
CVMdl = fitckernel(X,Y,'CrossVal','on');
PCVMdl = fitckernel(X(:,idxPart),Y,'CrossVal','on');
CVMdl and PCVMdl are ClassificationPartitionedKernel models. By default, the software implements 10-fold cross-validation. To specify a different number of folds, use the 'KFold' name-value pair argument instead of 'Crossval'.
Estimate the k-fold margins for each classifier.
fullMargins = kfoldMargin(CVMdl);
partMargins = kfoldMargin(PCVMdl);
Plot the distribution of the margin sets using box plots.
boxplot([fullMargins partMargins], ...
    'Labels',{'All Predictors','10% of the Predictors'});
title('Distribution of Margins')
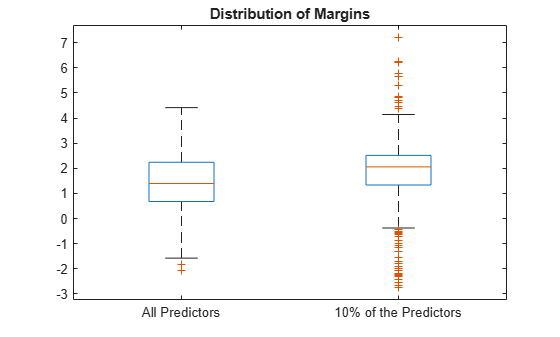
The quartiles of the PCVMdl margin distribution are situated higher than the quartiles of the CVMdl margin distribution, indicating that the PCVMdl model is the better classifier.