boxchart
Description
boxchart( creates a notched box plot of
the response data for each factor value of the one-way aov)anova object
aov. This syntax is supported only if the factor is
categorical.
boxchart(___, specifies
options using one or more name-value arguments in addition to any of the input argument
combinations in the previous syntaxes. For example, you can specify the box median line
color and the marker style. For a list of properties, see BoxChart Properties.Name=Value)
b = boxchart(___)b of BoxChart objects for the
generated box plots.
Examples
Load popcorn yield data.
load popcorn.matThe columns of the 6-by-3 matrix popcorn contain popcorn yield observations in cups for three different brands.
Perform a one-way ANOVA to test the null hypothesis that the popcorn yield is not affected by the brand of popcorn.
aov = anova(popcorn,FactorNames="Brand")aov =
1-way anova, constrained (Type III) sums of squares.
Y ~ 1 + Brand
SumOfSquares DF MeanSquares F pValue
____________ __ ___________ ____ __________
Brand 15.75 2 7.875 18.9 7.9603e-05
Error 6.25 15 0.41667
Total 22 17
Properties, Methods
The small p-value indicates that at least one brand has a different popcorn yield that is statistically significant.
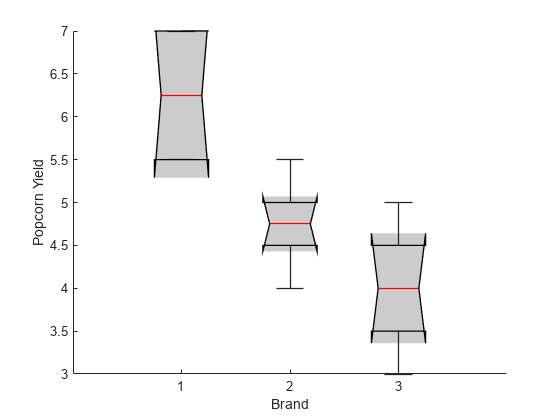
Create a box plot of the response data for each value of Brand.
boxchart(aov)
xlabel("Brand")
ylabel("Popcorn Yield")

The shaded region of the first box plot does not overlap with the shaded regions of the other box plots, indicating that the difference in popcorn yield for the first brand is statistically significant.
Load popcorn yield data.
load popcorn.matThe columns of the 6-by-3 matrix popcorn contain popcorn yield observations in cups for the brands Gourmet, National, and Generic. The first three rows of the matrix correspond to popcorn that was popped with an oil popper, and the last three rows correspond to popcorn that was popped with an air popper.
Create string arrays containing factor values for the brand and popper type by using the repmat function.
brand = [repmat("Gourmet",6,1);repmat("National",6,1);repmat("Generic",6,1)];
poppertype = [repmat("Air",3,1);repmat("Oil",3,1);repmat("Air",3,1);...
    repmat("Oil",3,1);repmat("Air",3,1);repmat("Oil",3,1)];
factors = {brand,poppertype};
Perform a two-way ANOVA to test the null hypothesis that the popcorn yield is not affected by the brand of popcorn, type of popper, or the interaction between the brand and type of popper.
aov = anova(factors,popcorn(:),FactorNames=["Brand","PopperType"],...
    ModelSpecification="interactions")
aov =
2-way anova, constrained (Type III) sums of squares.

Y ~ 1 + Brand*PopperType

                        SumOfSquares    DF    MeanSquares     F        pValue
                        ____________    __    ___________    ____    __________

    Brand                    15.75       2        7.875      56.7     7.679e-07
    PopperType                 4.5       1          4.5      32.4    0.00010037
    Brand:PopperType      0.083333       2     0.041667       0.3       0.74622
    Error                   1.6667      12      0.13889
    Total                       22      17


  Properties, Methods
aov is an anova object that contains the results of the two-way ANOVA. The small p-values for Brand and PopperType indicate that both the brand and type of popper have a statistically significant effect on the popcorn yield. The large p-value for Brand:PopperType indicates that not enough evidence exists to reject the null hypothesis that the interaction term does not have a statistically significant effect on the popcorn yield.
Use boxchart to plot the response data grouped by the values for Brand and the response data grouped by PopperType. To see the color boxchart assigns to each popper type, add a legend.
boxchart(aov,["Brand","PopperType"])
legend

The box plots indicate that the popcorn yield is higher for popcorn popped in oil, regardless of the brand. For each type of popper, the Gourmet brand yields the most popcorn and the Generic brand yields the least. This result is consistent with the results from the two-way ANOVA.
Load popcorn yield data.
load popcorn.matThe columns of the 6-by-3 matrix popcorn contain popcorn yield observations in cups for the brands Generic, Gourmet, and National. The first three rows of the matrix correspond to popcorn that was popped with an oil popper, and the last three rows correspond to popcorn that was popped with an air popper.
Create string arrays containing factor values for the brand and popper type using the function repmat.
brand = [repmat("Gour.",6,1);repmat("Nat.",6,1);repmat("Gen.",6,1)];
poppertype = [repmat("Air",3,1);repmat("Oil",3,1);repmat("Air",3,1);...
    repmat("Oil",3,1);repmat("Air",3,1);repmat("Oil",3,1)];
Perform a two-way ANOVA to test the null hypothesis that the popcorn yield is not affected by the brand of popcorn or type of popper.
aov = anova({brand,poppertype}, popcorn(:), FactorNames=["Brand","PopperType"]);Create a 1-by-2 tiled chart layout. In the first set of axes, plot the box plots for the brand. In the second set of axes, plot the box plots for the popper type.
tiledlayout(1,2)

% Left axes
ax1 = nexttile;
boxchart(ax1,aov,"Brand")
xlabel(ax1,"Brand")
ylabel(ax1,"Popcorn Yield")

% Right axes
ax2 = nexttile;
boxchart(ax2,aov,"PopperType")
xlabel(ax2,"Popper Type")

The box plot median lines indicate that the brand of popcorn has a larger effect on the popcorn yield than the type of popper.
Load popcorn yield data.
load popcorn.matThe columns of the 6-by-3 matrix popcorn contain popcorn yield observations in cups for three different brands.
Perform a one-way ANOVA to test the null hypothesis that the popcorn yield is not affected by the brand of popcorn.
aov = anova(popcorn,FactorNames="Brand")aov =
1-way anova, constrained (Type III) sums of squares.
Y ~ 1 + Brand
SumOfSquares DF MeanSquares F pValue
____________ __ ___________ ____ __________
Brand 15.75 2 7.875 18.9 7.9603e-05
Error 6.25 15 0.41667
Total 22 17
Properties, Methods
Plot the response data for the different values of Brand. Plot the median line in red, the box face in gray, and the box edges in black.
boxchart(aov,BoxFaceAlpha=0.2,BoxFaceColor="k",...
    BoxEdgeColor="k",BoxMedianLineColor="r")
xlabel("Brand")
ylabel("Popcorn Yield")
The shaded region of the first box plot does not overlap with the shaded regions of the other box plots, indicating that the difference in the popcorn yield for the first brand is statistically significant.
Input Arguments
Name-Value Arguments
Specify optional pairs of arguments as
Name1=Value1,...,NameN=ValueN, where Name is
the argument name and Value is the corresponding value.
Name-value arguments must appear after other arguments, but the order of the
pairs does not matter.
Example: Orientation="horizontal",BoxMedianLineColor="r",WhiskerLineStyle="--"
creates horizontal box plots with red median lines and dashed whiskers.
The BoxChart properties listed here are only a subset. For a complete
list, see BoxChart Properties.
Box color, specified as an RGB triplet, hexadecimal color code, color name, or short name. The box includes the box edges and median line. To specify the color of the box edges and median line separately, you can use the BoxEdgeColor property. To specify the color of the median line only, use the BoxMedianLineColor property.
For a custom color, specify an RGB triplet or a hexadecimal color code.
An RGB triplet is a three-element row vector whose elements specify the intensities of the red, green, and blue components of the color. The intensities must be in the range
[0,1]; for example,[0.4 0.6 0.7].A hexadecimal color code is a character vector or a string scalar that starts with a hash symbol (
#) followed by three or six hexadecimal digits, which can range from0toF. The values are not case sensitive. Thus, the color codes"#FF8800","#ff8800","#F80", and"#f80"are equivalent.
Alternatively, you can specify some common colors by name. This table lists the named color options, the equivalent RGB triplets, and hexadecimal color codes.
| Color Name | Short Name | RGB Triplet | Hexadecimal Color Code | Appearance |
|---|---|---|---|---|
"red" | "r" | [1 0 0] | "#FF0000" |
|
"green" | "g" | [0 1 0] | "#00FF00" |
|
"blue" | "b" | [0 0 1] | "#0000FF" |
|
"cyan"
| "c" | [0 1 1] | "#00FFFF" |
|
"magenta" | "m" | [1 0 1] | "#FF00FF" |
|
"yellow" | "y" | [1 1 0] | "#FFFF00" |
|
"black" | "k" | [0 0 0] | "#000000" |
|
"white" | "w" | [1 1 1] | "#FFFFFF" |
|
"none" | Not applicable | Not applicable | Not applicable | No color |
This table lists the default color palettes for plots in the light and dark themes.
| Palette | Palette Colors |
|---|---|
Before R2025a: Most plots use these colors by default. |
|
|
|
You can get the RGB triplets and hexadecimal color codes for these palettes using the orderedcolors and rgb2hex functions. For example, get the RGB triplets for the "gem" palette and convert them to hexadecimal color codes.
RGB = orderedcolors("gem");
H = rgb2hex(RGB);
Before R2023b: Get the RGB triplets using RGB =
get(groot,"FactoryAxesColorOrder").
Before R2024a: Get the hexadecimal color codes using H =
compose("#%02X%02X%02X",round(RGB*255)).
Example: BoxFaceColor="red"
Example: BoxFaceColor=[0 0.5 0.5]
Example: BoxFaceColor="#EDB120"
Outlier style, specified as one of the options listed in this table.
| Marker | Description | Resulting Marker |
|---|---|---|
"o" | Circle |
|
"+" | Plus sign |
|
"*" | Asterisk |
|
"." | Point |
|
"x" | Cross |
|
"_" | Horizontal line |
|
"|" | Vertical line |
|
"square" | Square |
|
"diamond" | Diamond |
|
"^" | Upward-pointing triangle |
|
"v" | Downward-pointing triangle |
|
">" | Right-pointing triangle |
|
"<" | Left-pointing triangle |
|
"pentagram" | Pentagram |
|
"hexagram" | Hexagram |
|
"none" | No markers | Not applicable |
Example: MarkerStyle="x"
Example: MarkerStyle="none"
Outlier marker displacement, specified as "on" or "off", or as numeric or logical 1 (true) or 0 (false). A value of "on" is equivalent to true, and "off" is equivalent to false. So, you can use the value of this property as a logical value. The value is stored as an on/off logical value of type matlab.lang.OnOffSwitchState.
If you set the JitterOutliers property to "on", then boxchart randomly displaces the outlier markers along the XData direction to help you distinguish between outliers that have similar aov.Y values. For an example, see Visualize and Find Outliers.
Example: JitterOutliers="on"
Median comparison display, specified as "on" or "off", or as numeric or logical 1 (true) or 0 (false). A value of "on" is equivalent to true, and "off" is equivalent to false. So, you can use the value of this property as a logical value. The value is stored as an on/off logical value of type matlab.lang.OnOffSwitchState.
If you set the Notch property to "on", then boxchart creates a tapered, shaded region around each median. Box plots whose notches do not overlap have different medians at the 5% significance level. For more information, see Box Chart (Box Plot).
Notches can extend beyond the lower and upper quartiles.
Example: Notch="off"
Orientation of box plots, specified as "vertical" or
"horizontal". By default, box plots have a vertical orientation,
so that the maov.Y statistics are aligned with the
y-axis. Regardless of the orientation,
boxchart stores the maov.Y values in the
YData property of the BoxChart
object.
Example: Orientation="horizontal";
Output Arguments
Version History
Introduced in R2022b