Manage Signal Lines
As a model grows, model components help functionally and visually organize blocks in the model. To similarly organize signal lines in the model, you can apply a variety of strategies, such as grouping signals into buses.
To demonstrate how to reduce signal line clutter, this example implements a plant with multiple sensors and actuators. The plant contains two identical mass-spring-damper systems. A beam connects the two masses.
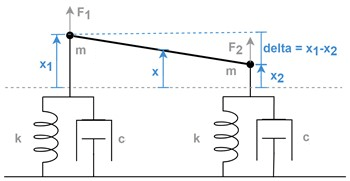
Sensors read the displacement of the masses. The controller regulates the height at the center of the beam and levels the beam by computing the force the actuators must apply to the masses. The controller uses the height difference between the beam ends, , to level the beam.
The model named BasicModelingSignals represents the plant and its environment, operator, and controller.
mdl0 = "BasicModelingSignals";
open_system(mdl0);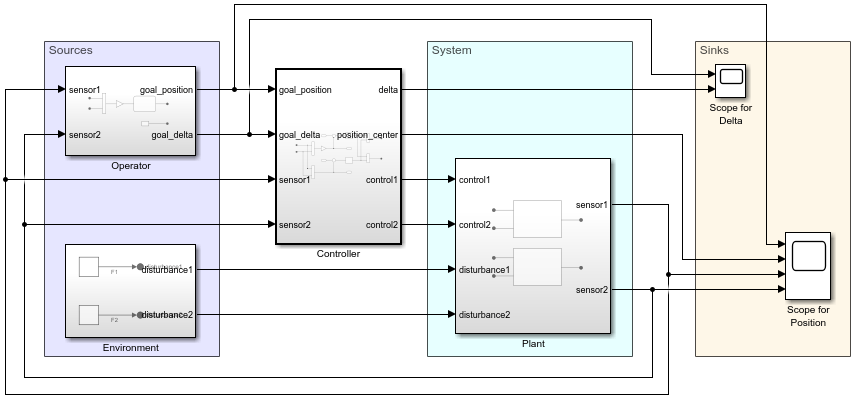
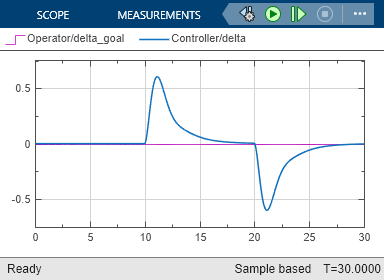
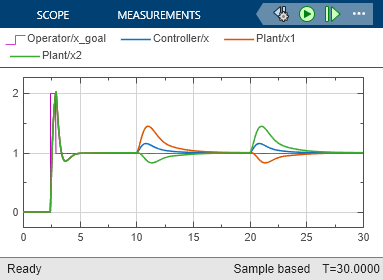
To display signals after simulation, the model uses two Scope blocks. One Scope block shows the goal and actual beam levelness. The other Scope block shows the goal and actual position of the beam at its center, along with the actual beam position at both ends.
sim(mdl0);
Mark Signals for Logging
To reduce the number of signal lines, you can connect a viewer directly to signal lines or enable data logging for signal lines. By choosing a way to visualize simulation data without using a sink block, you can avoid extra signal lines.
The model named BasicModelingLogging removes the Scope blocks and related signal lines then enables data logging for those signals.
mdl1 = "BasicModelingLogging";
open_system(mdl1);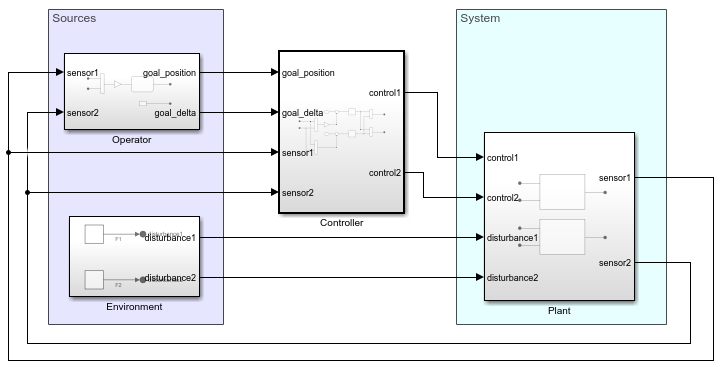
In the Operator subsystem, the signals labeled x_goal and delta_goal are marked for logging, as indicated by the icon that appears above each signal.

In the Controller subsystem, the signals labeled x and delta are marked for logging.

In the Plant subsystem, the signals labeled x1 and x2 are marked for logging.

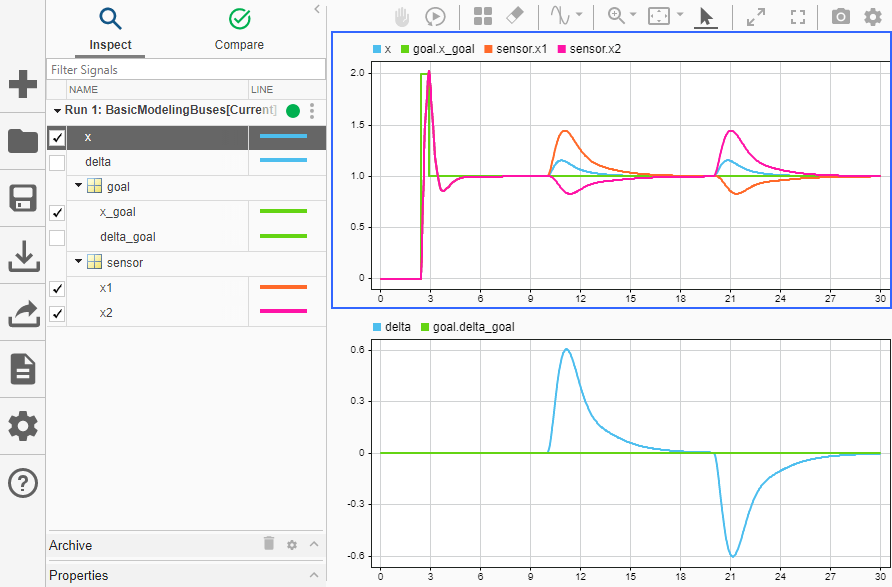
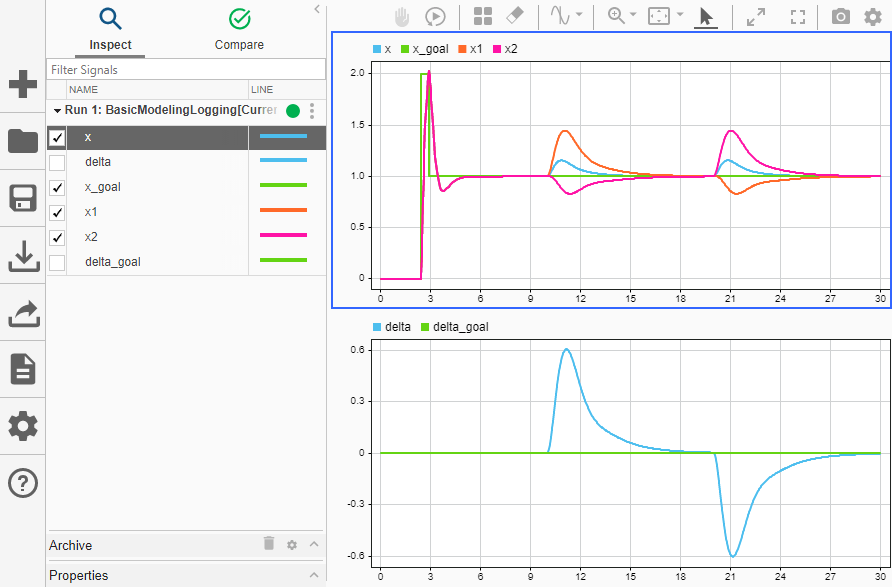
The Simulation Data Inspector lets you view the logged signal data after simulation.
sim(mdl1);
Group Signals in Buses
To further reduce the number of signal lines, you can group signal lines into a bus by using a Bus Creator or Out Bus Element block. All signal lines retain their identities when grouped in a bus and can be separated downstream from the bus.
By creating buses, the model named BasicModelingBuses provides an even more readable system representation. To view the bus line style, compile the model.
mdl2 = "BasicModelingBuses";
open_system(mdl2);
set_param(mdl2,SimulationCommand="Update");
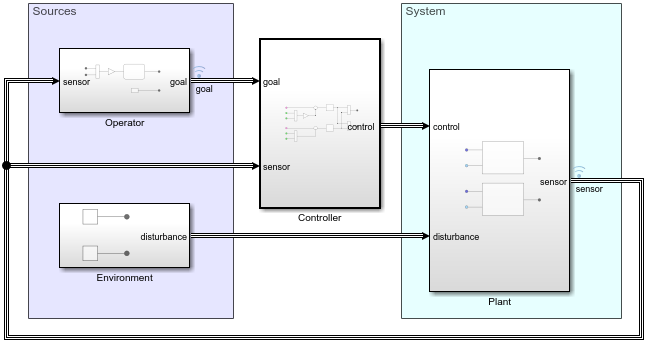
This model enables data logging for the signal lines associated with the buses named sensor and goal instead of logging data individually for each of the signals in these buses.
The simulation results remain the same after the signals are grouped in buses.
sim(mdl2);
