Main Content

Simulink.sdi.report

R2026b

Generate a Simulation Data Inspector report

Description

Simulink.sdi.report creates an HTML file that contains plot snapshots and metadata for signals plotted in the Inspect pane of the Simulation Data Inspector. The function saves this report in the sdireports folder in the working folder.

Simulink.sdi.report(Name=Value) creates a report as specified by one or more Name=Value arguments. For example, to create a report of the comparison results, specify ReportType="Compare".

example

Examples

collapse all

Create a report that contains metadata and plot snapshots for signals currently plotted in the Inspect pane of the Simulation Data Inspector. The report opens in the system browser once it is generated. The report HTML file is in the sdireports folder in the working directory.

By default, the report contains a table listing the block path, signal name, line color and style, and data source for all plotted signals.

Simulink.sdi.report
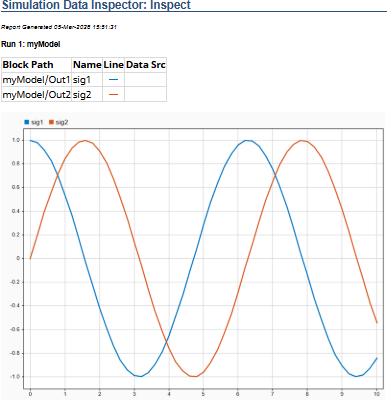
A report of the plotted signals in the Inspect pane with the default table of metadata

To specify the name of the report, use the ReportOutputFile name-value argument.

Simulink.sdi.report(ReportOutputFile="myReport.html")

To specify the signal metadata to report, use the ColumnsToReport name-value argument with properties of the Simulink.sdi.SignalMetaData object. For example, suppose that you want to report only the run name, signal name, and signal units in the reported metadata.

signalMetadata = [Simulink.sdi.SignalMetaData.Run,...
Simulink.sdi.SignalMetaData.Units,...
Simulink.sdi.SignalMetaData.SignalName];

Simulink.sdi.report(ColumnsToReport=signalMetadata)
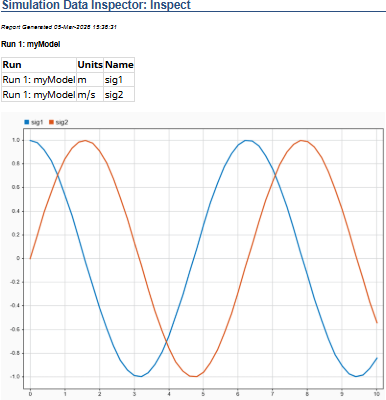
Report showing the run name, signal name, and units of the plotted signals in the Inspect pane of the Simulation Data Inspector.

The table in the report now includes only the specified metadata.

To share comparison results in a self-contained HTML file, create an interactive comparison report. You can use the report to analyze the comparison results similarly to how you would in the Simulation Data Inspector. For more information, see Create Interactive Comparison Reports.

Simulink.sdi.report(ReportType="Compare")

Name-Value Arguments

collapse all

Specify optional pairs of arguments as Name1=Value1,...,NameN=ValueN, where Name is the argument name and Value is the corresponding value. Name-value arguments must appear after other arguments, but the order of the pairs does not matter.

Example: ReportType="Compare",ShortenBlockPath=true

Type of report to create, specified as "Inspect" or "Compare".

  • "Inspect" –– Create a report that contains plot snapshots and metadata for signals plotted in the Inspect pane of the Simulation Data Inspector.

  • "Compare" –– Create a report that summarizes comparison results. The comparison report is interactive and includes plot snapshots of comparison results as well as metadata for the compared signals.

Example: ReportType="Compare"

Report title displayed in the header of a comparison report, specified as a string or character vector.

The report title is only visible in the comparison report.

Example: ReportType="Compare",ReportTitle="Trial 1 vs. Trial 2"

Report author displayed in the header of a comparison report, specified as a string or character vector.

The report author is only visible in the comparison report.

Example: ReportType="Compare",ReportAuthor="John Smith"

Folder where report is saved, specified as a string or character vector.

Example: ReportOutputFolder="C:\Users\user1\Desktop"

Report file name, specified as a string or character vector.

Example: ReportOutputFile="MyReport.html"

Whether to prevent overwriting report files, specified as true or false.

  • true prevents files from being overwritten.

  • false allows files to be overwritten.

File overwrite protection prevents the Simulation Data Inspector from overwriting an existing file by appending the file name with a number that increments each time you generate a report. When you disable file overwrite protection, the Simulation Data Inspector overwrites the existing report file unless you specify a unique file name.

Example: PreventOverwritingFile=false

Signal metadata to include in the report of signals plotted in the Inspect pane of the Simulation Data Inspector, specified as a Simulink.sdi.SignalMetaData enumeration array. By default, the Inspect report includes the block path, name, line style and color, and data source parameters for each plotted signal.

The ColumnsToReport name-value argument does not affect comparison reports. The comparison report always includes all signal metadata, and the summary at the top of the comparison report always includes the signal name, absolute tolerance, relative tolerance, maximum difference, and result for each signal comparison.

Specify metadata to include as an array, using the enumeration class Simulink.sdi.SignalMetaData. For example, to include only the name of the simulation run and signal name in the report define the Simulink.sdi.SignalMetaData enumeration array. Then, specify ColumnsToReport as signalMetadata.

signalMetadata = [Simulink.sdi.SignalMetaData.Run,...
                    Simulink.sdi.SignalMetaData.SignalName];
Simulink.sdi.report(ColumnsToReport=signalMetadata)

The table summarizes the metadata available for Inspect report.

Column ValueDescription
SignalName (default)Signal name
Line (default)Signal line style and color
SID

Automatically assigned Simulink® identifier

UnitsSignal measurement units
SigDataTypeSignal data type
SigSampleTimeMethod used to sample the signal
ModelName of the model that generated the signal
BlockNameName of the source block for the signal
BlockPath Path to the source block for the signal
PortIndex of the signal on the output port of its block
DimensionsDimensions of the matrix containing the signal
ChannelIndex of signal within matrix
RunName of the simulation run containing the signal
AbsTol Absolute tolerance for the signal
RelTol Relative tolerance for the signal
OverrideGlobalTolProperty that specifies whether signal tolerances take priority over global tolerances
TimeTolTime tolerance for the signal
InterpMethodInterpolation method
SyncMethodSynchronization method used to coordinate signals for comparison
TimeSeriesRootName of the variable associated with the signal for signals imported from the MATLAB® workspace
TimeSourceName of the array containing the time data for signals imported from the MATLAB workspace
DataSourceName of the array containing the signal data for signals imported from the MATLAB workspace

Example: ColumnsToReport=metadata

Whether to shorten block path in report, specified as true or false.

  • true –– Use the shortened block path in the report.

  • false –– Include the full block path in the report.

Example: ShortenBlockPath=false

Whether to open the report when it is created, specified as true or false.

  • true –– Open the report when it is created.

  • false –– Do not open the report automatically.

Example: LaunchReport=false

Signals to include in a comparison report, specified as "ReportOnlyMismatchedSignals" or "ReportAllSignals".

  • ReportOnlyMismatchedSignals –– Include only signals with out of tolerance comparison results.

  • ReportAllSignals –– Include all signals.

Example: SignalsToReport="ReportAllSignals"

Version History

Introduced in R2011b

expand all