Compensate for the Delay Introduced by an IIR Filter
Filtering a signal introduces a delay. This means that the output signal is shifted in time with respect to the input.
Infinite impulse response filters delay some frequency components more than others. They effectively distort the input signal. The function filtfilt compensates for the delays introduced by such filters, and thus corrects for filter distortion. This "zero-phase filtering" results from filtering the signal in the forward and backward directions.
Take an electrocardiogram reading sampled at 500 Hz for 1 second. Add random noise.
Fs = 500;
N = 500;

rng("default")
xn = ecg(N) + 0.2*randn([1 N]);
tn = (0:N-1)/Fs;
Remove some of the noise with a filter that stops frequencies above 75 Hz. Specify a 7th-order IIR filter with 1 dB of passband ripple and 60 dB of stopband attenuation.
Nf = 7;
Fp = 75;
Ap = 1;
As = 60;

d = designfilt("lowpassiir",FilterOrder=Nf, ...
    PassbandFrequency=Fp,PassbandRipple=Ap,StopbandAttenuation=As, ...
    SampleRate=Fs);
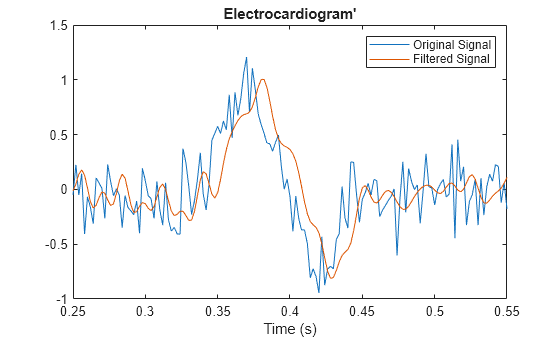
Filter the signal. The filtered signal is cleaner than the original, but lags in time with respect to it. It is also distorted due to the nonlinear phase of the filter. Zoom in close to the peak.
xfilter = filter(d,xn);

plot(tn,xn,tn,xfilter)

title("Electrocardiogram'")
xlabel("Time (s)")
legend(["Original Signal" "Filtered Signal"])
axis([0.25 0.55 -1 1.5])
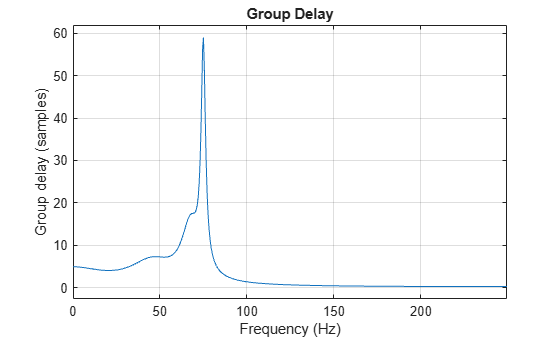
A look at the group delay introduced by the filter shows that the delay is frequency-dependent.
grpdelay(d,N,Fs)
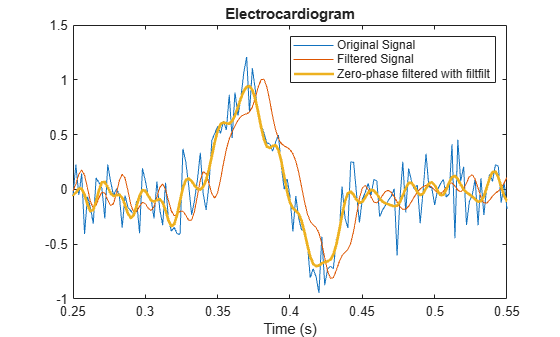
Filter the signal using filtfilt. The delay and distortion have been effectively removed. Use filtfilt when it is critical to keep the phase information of a signal intact.
xfiltfilt = filtfilt(d,xn);

plot(tn,xn,tn,xfilter)
hold on
plot(tn,xfiltfilt,LineWidth=2)
hold off

title("Electrocardiogram")
xlabel("Time (s)")
legend(["Original Signal" "Filtered Signal" ...
       "Zero-phase filtered with filtfilt"])
axis([0.25 0.55 -1 1.5])
See Also
designfilt | filter | filtfilt | grpdelay