Compensate for the Delay Introduced by an FIR Filter
Filtering a signal introduces a delay. This means that the output signal is shifted in time with respect to the input. This example shows you how to counteract this effect.
Finite impulse response filters often delay all frequency components by the same amount. This makes it easy to correct for the delay by shifting the signal in time.
Take an electrocardiogram reading sampled at 500 Hz for 1 s. Add random noise. Reset the random number generator for reproducibility.
Fs = 500;
N = 500;
rng default

xn = ecg(N)+0.25*randn([1 N]);
tn = (0:N-1)/Fs;
Remove some of the noise with a filter that stops frequencies above 75 Hz. Use designfilt to design a filter of order 70.
nfilt = 70;
Fst = 75;

d = designfilt('lowpassfir','FilterOrder',nfilt, ...
               'CutoffFrequency',Fst,'SampleRate',Fs);
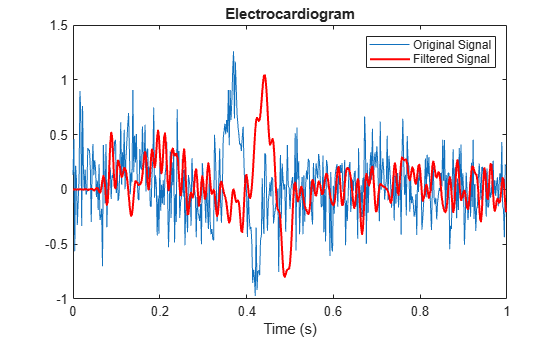
Filter the signal and plot it. The result is smoother than the original, but lags behind it.
xf = filter(d,xn);

plot(tn,xn)
hold on, plot(tn,xf,'-r','linewidth',1.5), hold off
title 'Electrocardiogram'
xlabel 'Time (s)', legend('Original Signal','Filtered Signal')
Use grpdelay to check that the delay caused by the filter equals half the filter order.
grpdelay(d,N,Fs)
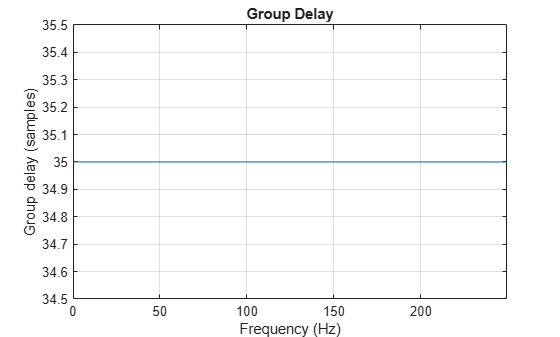
delay = mean(grpdelay(d))
delay =
35
Shift the filtered signal to line up the data. Remove its first delay samples. Remove the last delay samples of the original and of the time vector.
tt = tn(1:end-delay);
sn = xn(1:end-delay);

sf = xf;
sf(1:delay) = [];
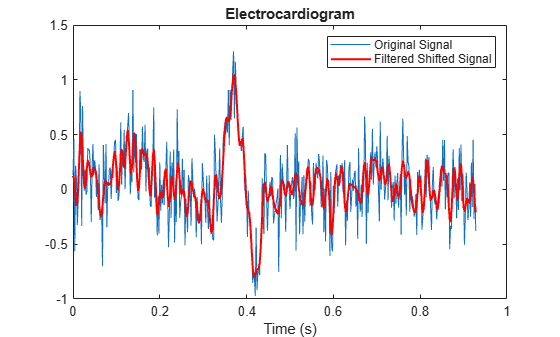
Plot the signals and verify that they are aligned.
plot(tt,sn)
hold on, plot(tt,sf,'-r','linewidth',1.5), hold off
title 'Electrocardiogram'
xlabel('Time (s)'), legend('Original Signal','Filtered Shifted Signal')
See Also
designfilt | filter | filtfilt | grpdelay