Display Labeled Medical Image Volume in Patient Coordinate System
This example shows how to display labeled 3-D medical image volumes by using volshow. The volshow function uses the spatial referencing information from a medicalVolume object to transform intrinsic image coordinates, in voxel units, to patient coordinates in real-world units such as millimeters. You can visualize labels as an overlay by using the OverlayData property of the Volume object created by volshow. If you do not have Medical Imaging Toolbox™ installed, see volshow (Image Processing Toolbox™).
Download Image Volume Data
This example uses a subset of the Medical Segmentation Decathlon data set [1]. The subset of data includes two CT chest volumes and corresponding label images, stored in the NIfTI file format.
Run this code to download the MedicalVolumNIfTIData.zip file from the MathWorks® website, then unzip the file. The size of the data file is approximately 76 MB.
zipFile = matlab.internal.examples.downloadSupportFile("medical","MedicalVolumeNIfTIData.zip");
filepath = fileparts(zipFile);
unzip(zipFile,filepath)
The folder dataFolder contains the downloaded and unzipped data.
dataFolder = fullfile(filepath,"MedicalVolumeNIfTIData");Specify the filenames of the CT volume and label image used in this example.
dataFile = fullfile(dataFolder,"lung_043.nii.gz");
labelDataFile = fullfile(dataFolder,"LabelData","lung_043.nii.gz");
Import Image Volume
Create a medical volume object that contains the image data and spatial referencing information for the CT volume. The Voxels property contains a numeric array of the voxel intensities. The VoxelSpacing property indicates that the voxels are anisotropic, with a size of 0.7695-by-0.7695-by-2.5 mm.
medVolData = medicalVolume(dataFile)
medVolData =
  medicalVolume with properties:

                 Voxels: [512×512×129 single]
         VolumeGeometry: [1×1 medicalref3d]
           SpatialUnits: "mm"
            Orientation: "transverse"
           VoxelSpacing: [0.7695 0.7695 2.5000]
           NormalVector: [0 0 -1]
       NumCoronalSlices: 512
      NumSagittalSlices: 512
    NumTransverseSlices: 129
           PlaneMapping: ["sagittal"    "coronal"    "transverse"]
               Modality: "unknown"
          WindowCenters: 0
           WindowWidths: 0
Import Label Data
Create a medical volume object that contains the label image data. The label image has the same spatial information as the intensity CT volume.
medvolLabels = medicalVolume(labelDataFile)
medvolLabels =
  medicalVolume with properties:

                 Voxels: [512×512×129 uint8]
         VolumeGeometry: [1×1 medicalref3d]
           SpatialUnits: "mm"
            Orientation: "transverse"
           VoxelSpacing: [0.7695 0.7695 2.5000]
           NormalVector: [0 0 -1]
       NumCoronalSlices: 512
      NumSagittalSlices: 512
    NumTransverseSlices: 129
           PlaneMapping: ["sagittal"    "coronal"    "transverse"]
               Modality: "unknown"
          WindowCenters: 0
           WindowWidths: 0
Display CT Volume with Tumor Overlay
Create a colormap and transparency map to display the rib cage. The alpha and color values are based on the CT-bone rendering style from the Medical Image Labeler app. The intensity values have been tuned for this volume using trial and error.
alpha = [0 0 0.72 1.0];
color = ([0 0 0; 186 65 77; 231 208 141; 255 255 255]) ./ 255;
intensity = [-3024 -700 -400 3071];

queryPoints = linspace(min(intensity),max(intensity),256);
alphamap = interp1(intensity,alpha,queryPoints)';
colormap = interp1(intensity,color,queryPoints);
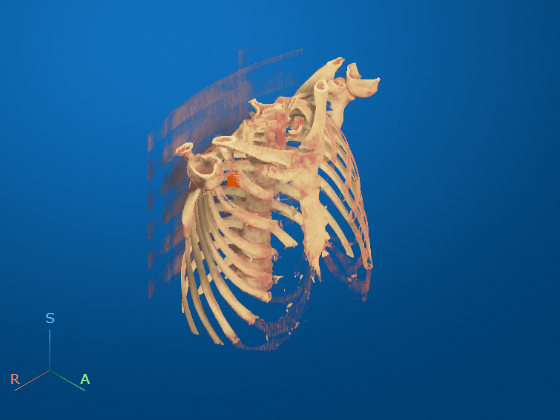
To display the volume in the patient coordinate system, pass the medicalVolume object as input to volshow. Use the CinematicRendering rendering style to view the volume with realistic lighting and shadows. Specify the custom colormap and transparency map. The volshow function uses the spatial details in medVol to set the Transformation property of the output Volume object, vol. The voxels are scaled to the correct anisotropic dimensions. The axes display indicators label the inferior/superior (S), left/right (L), and anterior/posterior (P) anatomical axes. Display the label overlay by specifying OverlayData and OverlayAlpha name-value arguments. Note that you must set the OverlayData value to the numeric array in the Voxels property of medVolLabels, rather than the medicalVolume object itself.
vol = volshow(medVolData, ...
    RenderingStyle="CinematicRendering", ...
    Colormap=colormap, ...
    Alphamap=alphamap, ...
    OverlayData=medvolLabels.Voxels, ...
    OverlayAlpha=1);
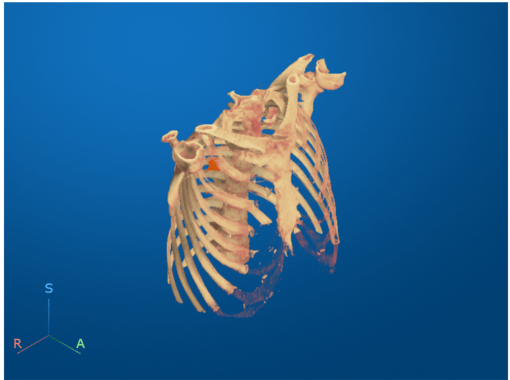
Optionally, you can clean up the viewer window by using the 3-D Scissors tool, ![]() , to remove the patient bed. For a detailed example, see Remove Objects from Volume Display Using 3-D Scissors.
, to remove the patient bed. For a detailed example, see Remove Objects from Volume Display Using 3-D Scissors.

This image shows the final volume after bed removal.
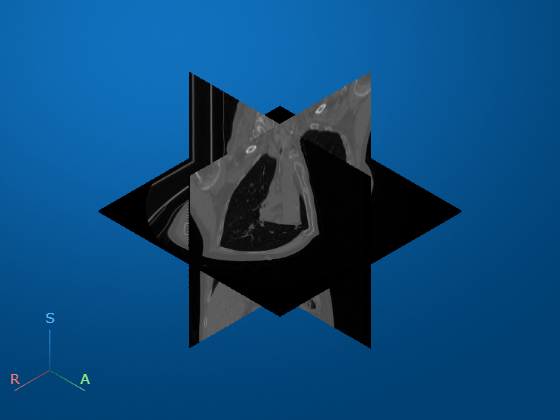
Display CT Volume as Slice Planes
Visualize the CT volume and label overlay as slice planes. Use the RenderingStyle name-value argument to specify the rendering style as "SlicePlanes". Specify the tumor label overlay using the OverlayData name-value argument. Note that you must set the OverlayData property to the numeric array in the Voxels property of medVolLabels, rather than the medicalVolume object itself.
volSlice = volshow(medVolData, ...
    OverlayData=medvolLabels.Voxels, ...
    RenderingStyle="SlicePlanes", ...
    Alphamap=linspace(0.01,0.2,256), ...
    OverlayAlpha=0.75);
To scroll through the transverse slices, pause the cursor on the transverse slice until it highlights in blue, then drag the cursor along the inferior/superior axis.
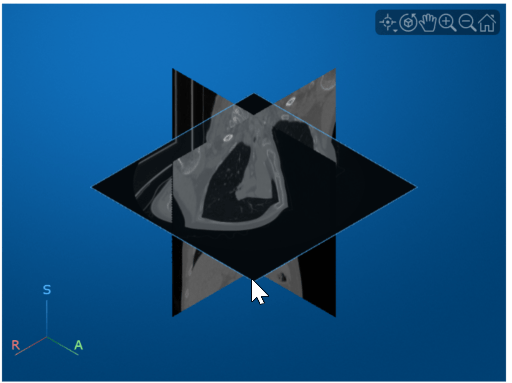
Drag the cursor to rotate the volume. The tumor overlay is visible in the slices for which the overlay is defined.

References
[1] Medical Segmentation Decathlon. "Lung." Tasks. Accessed May 10, 2018. http://medicaldecathlon.com/. The Medical Segmentation Decathlon data set is provided under the CC-BY-SA 4.0 license. All warranties and representations are disclaimed. See the license for details.
See Also
volshow | Volume Properties | medicalref3d | medicalVolume | intrinsicToWorldMapping
Related Topics
Select a Web Site
Choose a web site to get translated content where available and see local events and offers. Based on your location, we recommend that you select: United States.
You can also select a web site from the following list
Americas
- América Latina (Español)
- Canada (English)
- United States (English)
Europe
- Belgium (English)
- Denmark (English)
- Deutschland (Deutsch)
- España (Español)
- Finland (English)
- France (Français)
- Ireland (English)
- Italia (Italiano)
- Luxembourg (English)
- Netherlands (English)
- Norway (English)
- Österreich (Deutsch)
- Portugal (English)
- Sweden (English)
- Switzerland
- United Kingdom (English)
Asia Pacific
- Australia (English)
- India (English)
- New Zealand (English)
- 中国
- 日本Japanese (日本語)
- 한국Korean (한국어)