Main Content

Find Local Extrema

Find local maxima and minima in the Live Editor

Since R2019b

Description

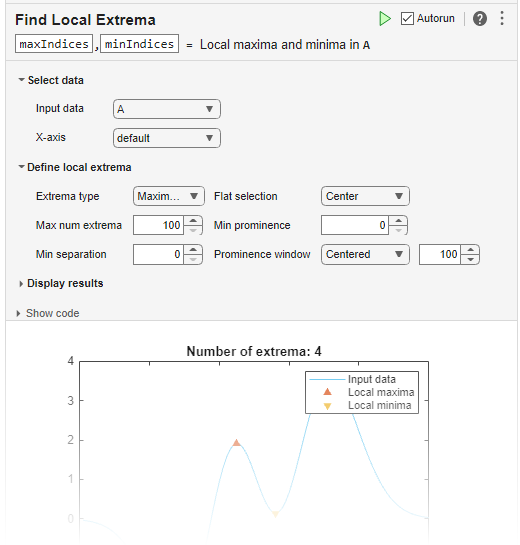
The Find Local Extrema task lets you interactively find local maxima and local minima in data. The task automatically generates MATLAB® code for your live script.

Using this task, you can:

  • Find local maxima, minima, or both in data from a workspace variable.

  • Adjust parameters to locate fewer or more extrema.

  • Visualize the detected extrema.

Related Functions

Find Local Extrema generates code that uses the islocalmin and islocalmax functions.

Find Local Extrema task in the Live Editor

Open the Task

To add the Find Local Extrema task to a live script in the MATLAB Editor:

  • On the Live Editor tab, select Task > Find Local Extrema.

  • In a code block in the script, type a relevant keyword, such as extrema, find, islocalmin, or max. Select Find Local Extrema from the suggested command completions. For some keywords, the task automatically updates one or more corresponding parameters.

Examples

expand all

Interactively find local minima in a vector of data using the Find Local Extrema task in the Live Editor.

Create a vector of data relative to the timestamps in the vector t.

t = hours(linspace(0,3,15));
data = [2 4 6 4 3 7 5 6 5 10 4 -1 -3 -2 0];

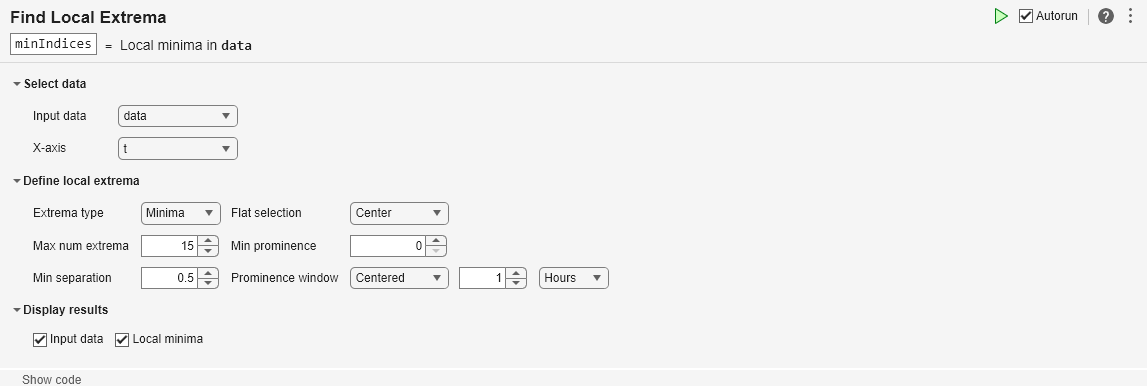
Open the Find Local Extrema task in the Live Editor. Select data as the input data and t as the x-axis coordinates of the data.

Specify the extrema type as Minima in the Extrema type field. Then, specify the minimum separation between local minima as 0.5 hours and the prominence window as 1 hour using the Min separation field, the Prominence window field, and the units drop-down.

Live Task

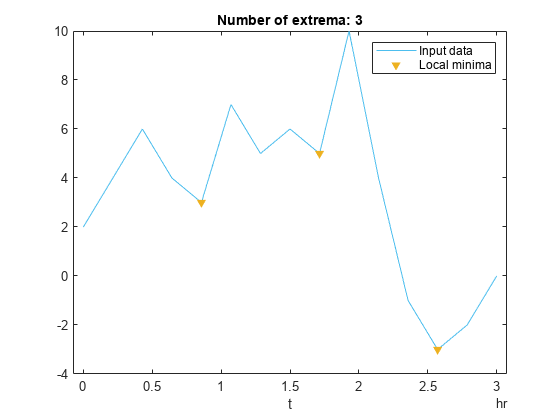
The title of the plot indicates that there are three local minima in data that are at least 0.5 hours apart.

You can use the output arguments of a Live Editor task in subsequent code. Use the indices returned by the task to determine the values of the local minima.

vals = data(minIndices)
vals = 1×3

     3     5    -3

Related Examples

Parameters

expand all

This task operates on input data contained in a vector, table, or timetable. The data can be of type single, double, logical, or signed or unsigned integer types such as int64.

When providing a table or timetable for the input data, select All supported variables to operate on all variables with a supported type. Select All numeric variables to operate on all variables of type single or double, or signed or unsigned integer types. To choose specific supported variables to operate on, select Specified variables and then select the variables individually.

Specify a flat region indicator when you have local consecutive extrema values.

MethodDescription
CenterIndicates only the center element of a flat region as the local extrema
FirstIndicates only the first element of a flat region as the local extrema
LastIndicates only the last element of a flat region as the local extrema
AllIndicates all the elements of a flat region as the local extrema

Specify a minimum prominence to return only local extrema whose prominence is at least that value. Higher prominence values return fewer detected extrema.

The prominence of a local maximum (or peak) is a measure of how the peak stands out with respect to its height and location relative to other peaks. The prominence of a local minimum (or valley) is a measure of how the valley stands out with respect to its depth and location relative to other valleys.

Specify a prominence window type and size to define a window of neighboring points for which to compute the prominence for each local extrema.

WindowDescription
CenteredSpecified window length centered about the current point
AsymmetricSpecified window containing the number of elements before the current point and the number of elements after the current point

Window sizes are relative to the X-axis variable units.

Version History

Introduced in R2019b

expand all