Main Content

Thematic Maps

Convey attribute data on choropleth, classification, bubble, scatter, contour, and stem maps

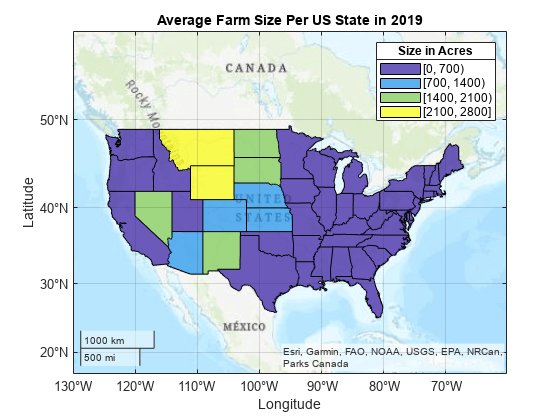
Thematic maps portray attributes of locations and features. For example, you can use a choropleth map to show election results by state, a contour plot to show aircraft visibility at different elevations, and a bubble chart to show populations for different cities.

Functions

expand all

geoplotPlot points, lines, and polygons on map
bubblechartBubble chart
geoscatterScatter chart in geographic coordinates
scattermProject scatter plot on axesm-based map
clabelmLabel map contour plot
clegendmAdd legend labels to map contour display
contourcbarColor bar for filled contour map display
contourcmapContour colormap and color bar
contourmProject 2-D contour plot of map data
contour3mProject 3-D contour plot of map data
contourfmProject filled 2-D contour plot of map data
quivermProject 2-D quiver plot on axesm-based map
quiver3mProject 3-D quiver plot on axesm-based map
stem3mProject stem plot on axesm-based map
colorbarColorbar showing color scale
lcolorbarColor bar with text labels
polcmap Create colormap appropriate to political regions
ind2rgb8Convert indexed image to uint8 RGB image

Topics

  • Thematic Maps

    Thematic maps portray attributes of locations and features. For example, a thematic map could show the population density by region, or election results by state.

  • Create Choropleth Map of Population Density

    This example shows how to create a choropleth map, in which the color of each state represents the population density of the state.