Main Content

measureIlluminant

R2026b

Measure scene illuminant using test chart

Description

Test Chart Object

illuminant = measureIlluminant(chart) measures the scene illuminant using the gray ROIs of an image-based or simulated test chart.

example

Test Chart Image

illuminant = measureIlluminant(im,roiPositions) measures the scene illuminant using gray ROIs at positions roiPositions for test chart image im.

example

illuminant = measureIlluminant(im,roiPositions,InputColorSpace=inputColorSpace) also specifies the input color space of the test chart image.

Examples

collapse all

This example shows how to measure the illuminant of an eSFR chart using the gray patch ROIs. The example then white balances the image of the eSFR chart.

Read and display an image of an eSFR chart. The test chart is in the sRGB color space.

I = imread("eSFRTestImage.jpg");
imshow(I)
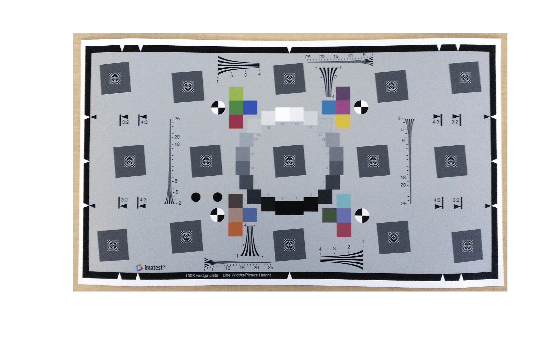
Figure contains an axes object. The hidden axes object contains an object of type image.

Linearize the test chart using the rgb2lin function, then create an esfrChart object.

Ilin = rgb2lin(I);
chart = esfrChart(Ilin);

Estimate the illuminant in the linear RGB color space. The illuminant has a stronger blue component than the red and green. This result is consistent with the image of the test chart, which has a blue tint.

illum = measureIlluminant(chart)
illum = 1×3

   69.2527   73.5922   80.5141

White balance the chart image in the linear RGB color space.

Jlin = chromadapt(Ilin,illum,ColorSpace="linear-rgb");

Convert the white-balanced image to the sRGB color space and display the result. The white balanced image has less of a blue tint, especially in the middle gray patches and over the background of the image.

J = lin2rgb(Jlin);
imshow(J)
title("White Balanced Test Chart")
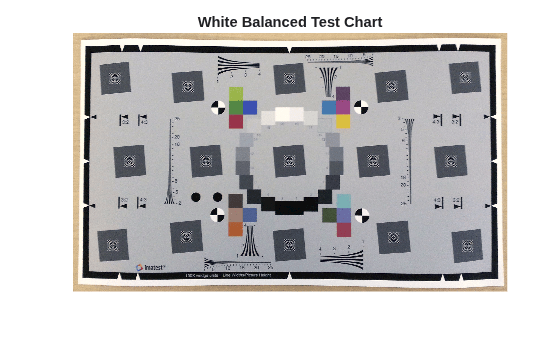
Figure contains an axes object. The hidden axes object with title White Balanced Test Chart contains an object of type image.

You can use the estimated illuminant to white balance other images acquired under similar lighting conditions.

Read and display an image of a custom test chart. This example simulates a custom test chart image by cropping an Imatest eSFR test chart.

I = imread("RGBColorPatches.jpg");
imshow(I)
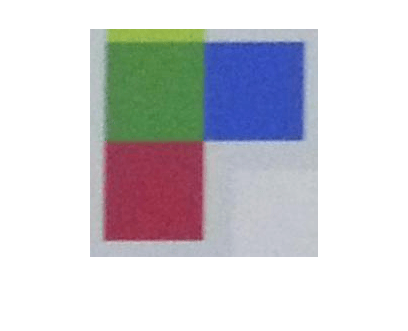
Figure contains an axes object. The axes object contains an object of type image.

Draw an ROI around a region with gray pixels.

numROIs = 1;
roiPos = zeros(numROIs,4);
for cnt = 1:numROIs
    hrect = drawrectangle;
    roiPos(cnt,:) = hrect.Position;
end  
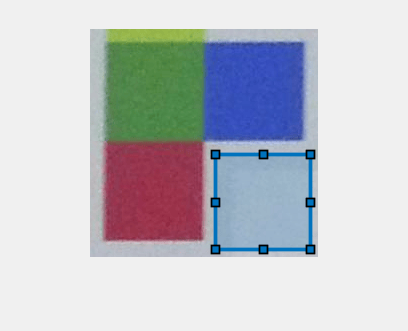
Figure contains an axes object. The axes object contains 2 objects of type image, images.roi.rectangle.

Measure the scene illuminant in the sRGB color space.

illum = measureIlluminant(I,roiPos)
illum = 1×3

    0.5180    0.5386    0.5827

White balance the chart image in the sRGB color space, and display the result.

J = chromadapt(I,illum);
imshow(J)
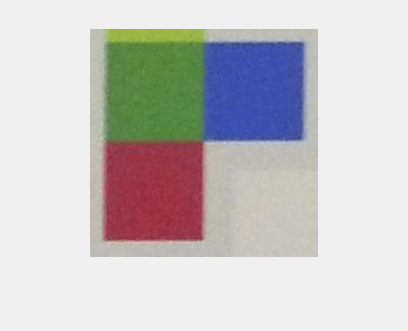
Figure contains an axes object. The axes object contains an object of type image.

Input Arguments

collapse all

Test chart for which to automatically detect the gray regions of interest (ROIs), specified as an esfrChart object, colorChecker object, SimulatedColorCheckerChart object, or SimulatedESFRChart object.

  • If you specify chart as an esfrChart object, then the measureIlluminant function assumes uniform illumination and linear RGB values. If you have nonlinear sRGB or Adobe RGB images, then use the rgb2lin function to undo the gamma correction before creating the test chart object.

  • If you specify chart as an SimulatedESFRChart or SimulatedColorCheckerChart, then the measureIlluminant function assumes uniform illumination and linear RGB values. The function automatically converts the simulated chart data from sRGB to linear RGB before measurement (since R2026b).

  • If you specify chart as a colorChecker object, then the measureIlluminant function uses the color space specified by the InputColorSpace property of the object (since R2026b).

Use a SimulatedESFRChart or SimulatedColorCheckerChart object when you want to evaluate illuminant estimation under controlled, spatially uniform illumination using a chart rendered through an optical system with known optical and sensor effects.

Since R2024a

Test chart image, specified as an RGB image.

For test chart images, the measureIlluminant function expects images in a nonlinear RGB color space, according to the value of the inputColorSpace argument. If you have linear RGB images, use the lin2rgb function to apply gamma correction before calling the measureIlluminant function.

Data Types: single | double | uint8 | uint16

Since R2024a

ROI positions, specified as an n-by-4 numeric array, where n is the number of ROIs. Each ROI has the form [X Y Width Height], where X and Y are the coordinates of the top-left corner of the ROI. Width and Height are the width and height of the ROI, in pixels.

Since R2024a

Input color space of test chart image im, specified as "srgb", "adobe-rgb-1998", or "prophoto-rgb". You can set this name-value argument only when you use a test chart image im.

Data Types: char | string

Output Arguments

collapse all

Scene illuminant, returned as a 3-element row vector.

Data Types: double

Tips

  • For esfrChart and colorChecker objects, the measureIlluminant function calculates the illuminant by first calculating the mean intensity of each gray patch ROI, then by taking the average of the mean intensities. The function performs the calculation for each color channel independently.

  • For test chart images im, the measureIlluminant function calculates the illuminant by using the illumgray function. The measurement includes all pixels within the ROI by specifying the percentage argument of the illumgray function as 0.

  • To white-balance an image, use the chromadapt function.

References

[2] Calibrite. "ColorChecker Classic". https://calibrite.com/us/product/colorchecker-classic/.

Version History

Introduced in R2017b

expand all