drawpolygon
Create customizable polygonal ROI
Description
The drawpolygon function creates a Polygon
object that specifies the shape and position of a polygonal region of interest (ROI).
You can create the ROI interactively by drawing the ROI over an image using the mouse,
or programmatically by using name-value arguments. You can also specify the initial
appearance and behavior of the ROI.
After you create the ROI, you can use object properties, object functions, and event notifications to customize the shape, position, appearance, and behavior of the ROI. For more information about using these capabilities, see Tips.
roi = drawpolygonPolygon object and enables interactive drawing of a polygonal
ROI on the current axes.
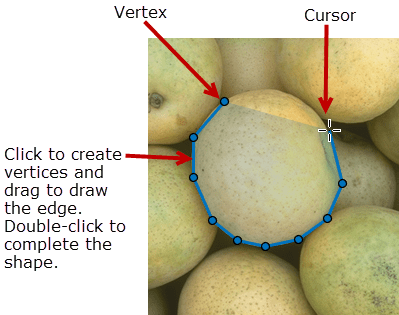
To draw the ROI, position the pointer on the image. The cursor changes to a fleur shape. Click to draw vertices of the polygon and drag to draw the lines between the vertices. To finish the ROI, double-click the mouse button. For more information about using the ROI, including keyboard shortcuts and context menu options, see Tips.
roi = drawpolygon(___,Name=Value)
Examples
Read an image into the workspace and display it.
imshow(imread('strawberries.jpg'))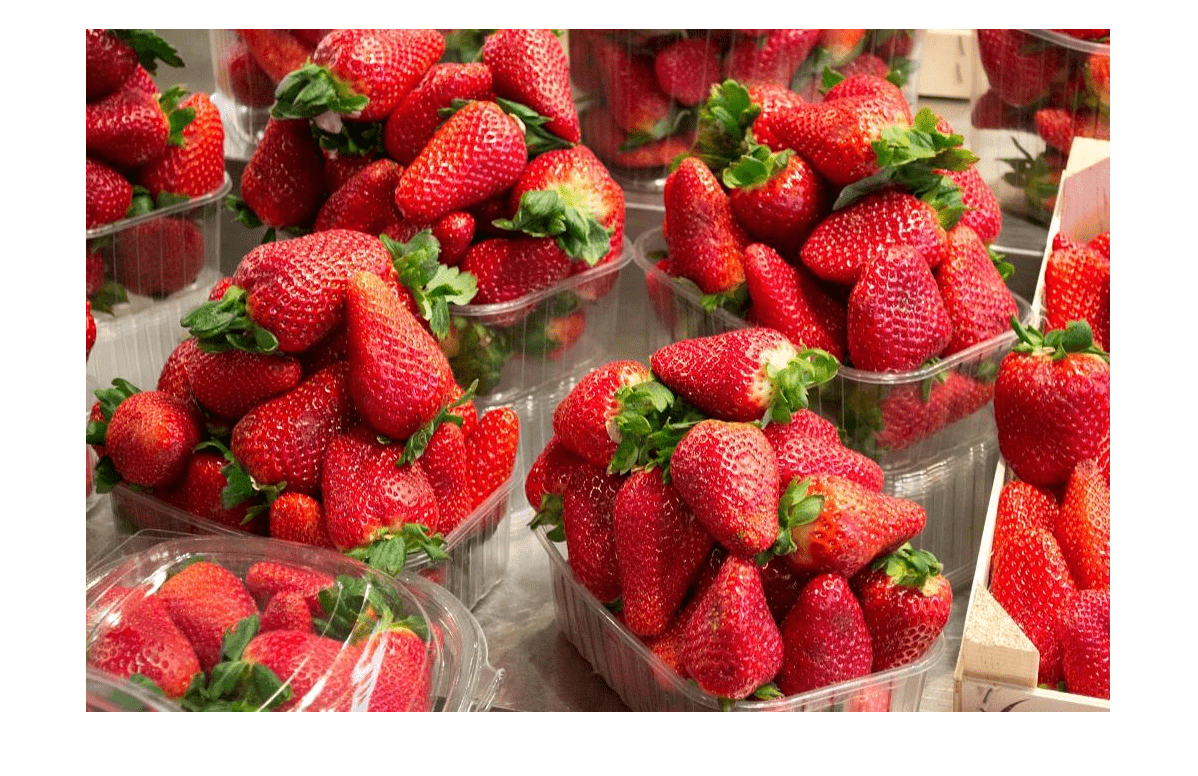
Draw a polygonal ROI on the image. Use the 'FaceAlpha' name-value pair to make the face of the ROI transparent.
h = drawpolygon('FaceAlpha',0);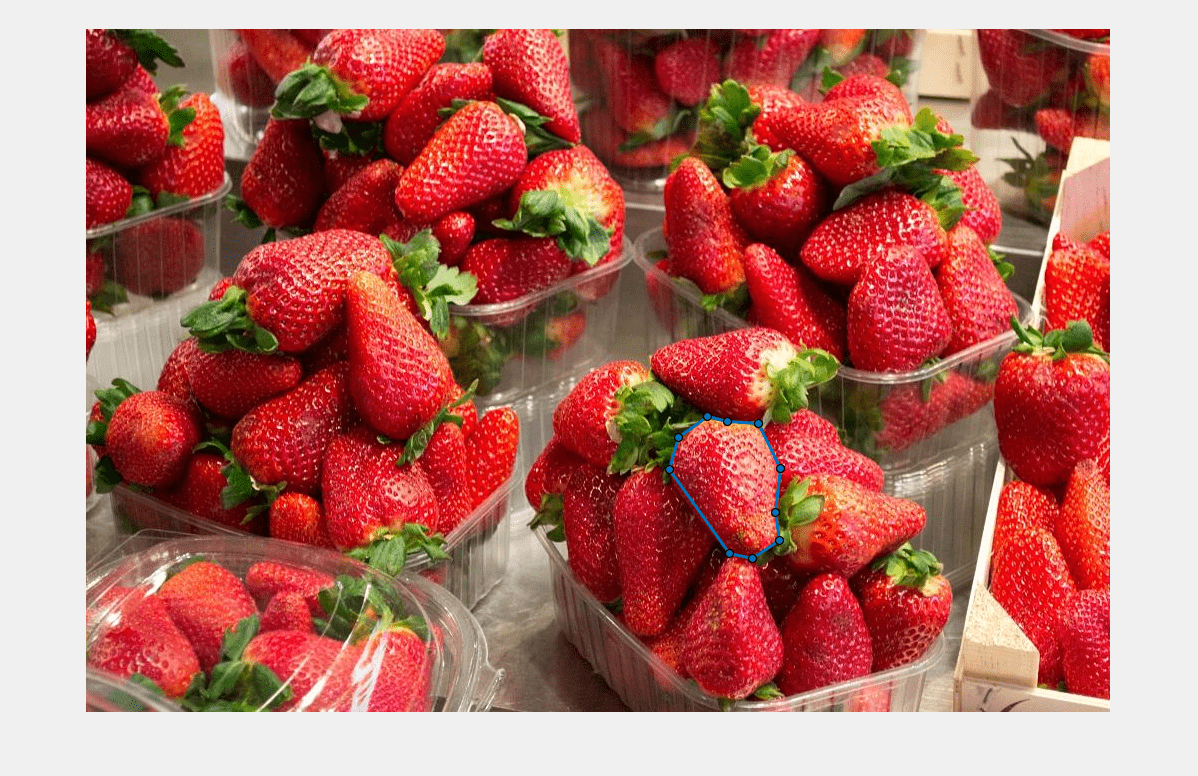
Change the color of the polygon outline by setting the 'Color' property of the ROI.
h.Color = 'yellow';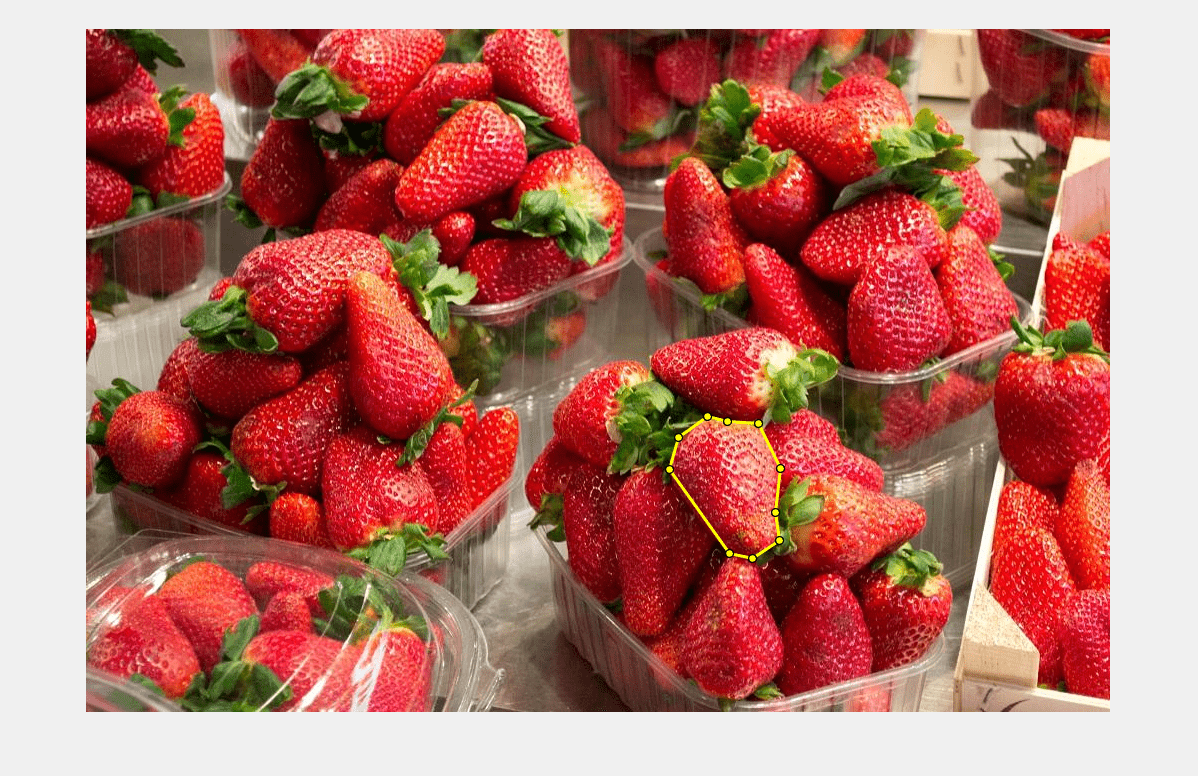
Read image into the workspace and display it.
I = imread('baby.jpg');
figure
imshow(I)
Draw a polygonal ROI over the image, using the Position parameter to specify the location of vertices.
my_vertices = [500 500;400 600;400 700;500 800;600 800;700 700; 700 600];
h = drawpolygon('Position',my_vertices);
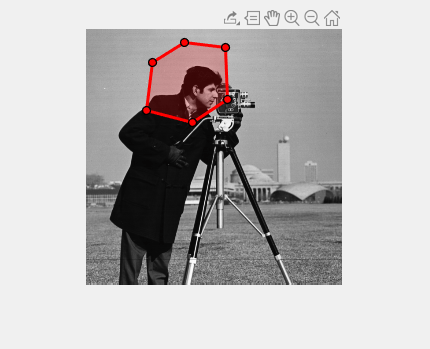
Read an image into the workspace.
I = imread('cameraman.tif'); Display the image.
imshow(I);
Draw a polygonal ROI on the image.
roi = drawpolygon('Color','r');
Set up listeners for ROI moving events. When you move it, the ROI sends notifications of these events and executes the callback function you specify.
addlistener(roi,'MovingROI',@allevents);
addlistener(roi,'ROIMoved',@allevents);
The allevents callback function displays the previous position and the current position of the ROI.
function allevents(src,evt)
    evname = evt.EventName;
    switch(evname)
        case{'MovingROI'}
            disp(['ROI moving previous position: ' mat2str(evt.PreviousPosition)]);
            disp(['ROI moving current position: ' mat2str(evt.CurrentPosition)]);
        case{'ROIMoved'}
            disp(['ROI moved previous position: ' mat2str(evt.PreviousPosition)]);
            disp(['ROI moved current position: ' mat2str(evt.CurrentPosition)]);
    end
end
Input Arguments
Name-Value Arguments
Specify optional pairs of arguments as
Name1=Value1,...,NameN=ValueN, where Name is
the argument name and Value is the corresponding value.
Name-value arguments must appear after other arguments, but the order of the
pairs does not matter.
Example: roi = drawpolygon(Color="y") creates a yellow colored
Polygon object.
Before R2021a, use commas to separate each name and value, and enclose
Name in quotes.
Example: roi = drawpolygon("Color","y") creates a yellow colored
Polygon object.
Shape and Position
Color and Styling
ROI color, specified as an RGB triplet, a hexadecimal color code, a color name, or a short color name.
For a custom color, specify an RGB triplet or a hexadecimal color code.
An RGB triplet is a three-element row vector whose elements specify the intensities of the red, green, and blue components of the color. The intensities must be in the range
[0,1], for example,[0.4 0.6 0.7].A hexadecimal color code is a string scalar or character vector that starts with a hash symbol (
#) followed by three or six hexadecimal digits, which can range from0toF. The values are not case sensitive. Therefore, the color codes"#FF8800","#ff8800","#F80", and"#f80"are equivalent.
Alternatively, you can specify some common colors by name. This table lists the named color options, the equivalent RGB triplets, and the hexadecimal color codes.
| Color Name | Short Name | RGB Triplet | Hexadecimal Color Code | Appearance |
|---|---|---|---|---|
"red" | "r" | [1 0 0] | "#FF0000" |
|
"green" | "g" | [0 1 0] | "#00FF00" |
|
"blue" | "b" | [0 0 1] | "#0000FF" |
|
"cyan"
| "c" | [0 1 1] | "#00FFFF" |
|
"magenta" | "m" | [1 0 1] | "#FF00FF" |
|
"yellow" | "y" | [1 1 0] | "#FFFF00" |
|
"black" | "k" | [0 0 0] | "#000000" |
|
"white" | "w" | [1 1 1] | "#FFFFFF" |
|
This table lists the default color palettes for plots in the light and dark themes.
| Palette | Palette Colors |
|---|---|
Before R2025a: Most plots use these colors by default. |
|
|
|
You can get the RGB triplets and hexadecimal color codes for these palettes using the
orderedcolors
and rgb2hex
functions. For example, get the RGB triplets for the "gem" palette and
convert them to hexadecimal color
codes.
RGB = orderedcolors("gem");
H = rgb2hex(RGB);
Before R2023b: Get the RGB triplets using RGB =
get(groot,"FactoryAxesColorOrder").
Example: Color="r"
Example: Color="green"
Example: Color=[0 0.4470 0.7410]
Example: Color="#00FFFF"
Transparency of the ROI face, specified as a number in the range [0, 1]. When the value is
1, the ROI face is completely opaque. When the value is
0, the ROI face is completely transparent.
Width of the ROI border, specified as a positive number in points. The default value is three times the number of points per screen pixel, such that the border is three pixels wide.
Marker size, specified as a positive number in points. The default value is eight times the number of points per screen pixel, such that markers are eight pixels in size.
Color of the ROI when selected, specified as an RGB triplet, a hexadecimal color code,
a color name, a short color name, or "none". If you specify
"none", then the value of Color defines the
color of the ROI for all states, selected or not.
For a custom color, specify an RGB triplet or a hexadecimal color code.
An RGB triplet is a three-element row vector whose elements specify the intensities of the red, green, and blue components of the color. The intensities must be in the range
[0,1], for example,[0.4 0.6 0.7].A hexadecimal color code is a string scalar or character vector that starts with a hash symbol (
#) followed by three or six hexadecimal digits, which can range from0toF. The values are not case sensitive. Therefore, the color codes"#FF8800","#ff8800","#F80", and"#f80"are equivalent.
Alternatively, you can specify some common colors by name. This table lists the named color options, the equivalent RGB triplets, and the hexadecimal color codes.
| Color Name | Short Name | RGB Triplet | Hexadecimal Color Code | Appearance |
|---|---|---|---|---|
"red" | "r" | [1 0 0] | "#FF0000" |
|
"green" | "g" | [0 1 0] | "#00FF00" |
|
"blue" | "b" | [0 0 1] | "#0000FF" |
|
"cyan"
| "c" | [0 1 1] | "#00FFFF" |
|
"magenta" | "m" | [1 0 1] | "#FF00FF" |
|
"yellow" | "y" | [1 1 0] | "#FFFF00" |
|
"black" | "k" | [0 0 0] | "#000000" |
|
"white" | "w" | [1 1 1] | "#FFFFFF" |
|
This table lists the default color palettes for plots in the light and dark themes.
| Palette | Palette Colors |
|---|---|
Before R2025a: Most plots use these colors by default. |
|
|
|
You can get the RGB triplets and hexadecimal color codes for these palettes using the
orderedcolors
and rgb2hex
functions. For example, get the RGB triplets for the "gem" palette and
convert them to hexadecimal color
codes.
RGB = orderedcolors("gem");
H = rgb2hex(RGB);
Before R2023b: Get the RGB triplets using RGB =
get(groot,"FactoryAxesColorOrder").
Example: SelectedColor="r"
Example: SelectedColor="green"
Example: SelectedColor=[0 0.4470 0.7410]
Example: SelectedColor="#00FFFF"
Color of the ROI stripe, specified as an RGB triplet, a hexadecimal color code, a
color name, a short color name, or "none". If you specify
"none", then the ROI edge is a solid color specified by
Color. Otherwise, the edge of the ROI is striped, with colors
alternating between the colors specified by Color and
StripeColor.
For a custom color, specify an RGB triplet or a hexadecimal color code.
An RGB triplet is a three-element row vector whose elements specify the intensities of the red, green, and blue components of the color. The intensities must be in the range
[0,1], for example,[0.4 0.6 0.7].A hexadecimal color code is a string scalar or character vector that starts with a hash symbol (
#) followed by three or six hexadecimal digits, which can range from0toF. The values are not case sensitive. Therefore, the color codes"#FF8800","#ff8800","#F80", and"#f80"are equivalent.
Alternatively, you can specify some common colors by name. This table lists the named color options, the equivalent RGB triplets, and the hexadecimal color codes.
| Color Name | Short Name | RGB Triplet | Hexadecimal Color Code | Appearance |
|---|---|---|---|---|
"red" | "r" | [1 0 0] | "#FF0000" |
|
"green" | "g" | [0 1 0] | "#00FF00" |
|
"blue" | "b" | [0 0 1] | "#0000FF" |
|
"cyan"
| "c" | [0 1 1] | "#00FFFF" |
|
"magenta" | "m" | [1 0 1] | "#FF00FF" |
|
"yellow" | "y" | [1 1 0] | "#FFFF00" |
|
"black" | "k" | [0 0 0] | "#000000" |
|
"white" | "w" | [1 1 1] | "#FFFFFF" |
|
This table lists the default color palettes for plots in the light and dark themes.
| Palette | Palette Colors |
|---|---|
Before R2025a: Most plots use these colors by default. |
|
|
|
You can get the RGB triplets and hexadecimal color codes for these palettes using the
orderedcolors
and rgb2hex
functions. For example, get the RGB triplets for the "gem" palette and
convert them to hexadecimal color
codes.
RGB = orderedcolors("gem");
H = rgb2hex(RGB);
Before R2023b: Get the RGB triplets using RGB =
get(groot,"FactoryAxesColorOrder").
Example: StripeColor="r"
Example: StripeColor="green"
Example: StripeColor=[0 0.4470 0.7410]
Example: StripeColor="#00FFFF"
ROI visibility, specified as "on" or "off", or as
. A value of "on" is equivalent to
true, and "off" is equivalent to
false. The value is stored as an on/off logical value of type
OnOffSwitchState.
| Value | Description |
|---|---|
"on" | Display the ROI. |
"off" | Hide the ROI without deleting it. You can still access the properties of an invisible ROI. |
Labels
ROI label, specified as a character vector or string scalar. By default, the ROI has no label
('').
Transparency of the text background, specified as a number in the range [0, 1]. When
set to 1, the text background is completely opaque. When set to
0, the text background is completely transparent.
Label text color, specified as an RGB triplet, a hexadecimal color code, a color name, or a short color name.
For a custom color, specify an RGB triplet or a hexadecimal color code.
An RGB triplet is a three-element row vector whose elements specify the intensities of the red, green, and blue components of the color. The intensities must be in the range
[0,1], for example,[0.4 0.6 0.7].A hexadecimal color code is a string scalar or character vector that starts with a hash symbol (
#) followed by three or six hexadecimal digits, which can range from0toF. The values are not case sensitive. Therefore, the color codes"#FF8800","#ff8800","#F80", and"#f80"are equivalent.
Alternatively, you can specify some common colors by name. This table lists the named color options, the equivalent RGB triplets, and the hexadecimal color codes.
| Color Name | Short Name | RGB Triplet | Hexadecimal Color Code | Appearance |
|---|---|---|---|---|
"red" | "r" | [1 0 0] | "#FF0000" |
|
"green" | "g" | [0 1 0] | "#00FF00" |
|
"blue" | "b" | [0 0 1] | "#0000FF" |
|
"cyan"
| "c" | [0 1 1] | "#00FFFF" |
|
"magenta" | "m" | [1 0 1] | "#FF00FF" |
|
"yellow" | "y" | [1 1 0] | "#FFFF00" |
|
"black" | "k" | [0 0 0] | "#000000" |
|
"white" | "w" | [1 1 1] | "#FFFFFF" |
|
This table lists the default color palettes for plots in the light and dark themes.
| Palette | Palette Colors |
|---|---|
Before R2025a: Most plots use these colors by default. |
|
|
|
You can get the RGB triplets and hexadecimal color codes for these palettes using the
orderedcolors
and rgb2hex
functions. For example, get the RGB triplets for the "gem" palette and
convert them to hexadecimal color
codes.
RGB = orderedcolors("gem");
H = rgb2hex(RGB);
Before R2023b: Get the RGB triplets using RGB =
get(groot,"FactoryAxesColorOrder").
Example: LabelTextColor="r"
Example: LabelTextColor="green"
Example: LabelTextColor=[0 0.4470 0.7410]
Example: LabelTextColor="#00FFFF"
Label visibility, specified as one of these values.
| Value | Description |
|---|---|
"on" | Label is visible when the ROI is visible. |
"hover" | Label is visible only when the mouse is hovering over the ROI. |
"off" | Label is not visible. |
Interactivity
Parent/Child
Identifiers
Output Arguments
Tips
The ROI supports the following interactivity, including keyboard shortcuts.
Behavior Keyboard shortcut Make drawn line snap at 15 degree angles. Hold the Shift key while drawing. Finish drawing (close) the ROI. Double-click, which adds a new vertex at the pointer position and draws a line to the first vertex to close the polygon.
Press Enter, which adds a new vertex at the pointer position and draws a line to the first vertex to close the polygon.
Right-click, which does not add a new vertex but closes the polygon from the previous vertex.
Position pointer over the first vertex and click.
Cancel drawing the ROI. Press Esc. The function returns a valid ROI object with an empty Positionproperty.Add a new vertex to the ROI. Position the pointer over the edge of the ROI and double-click.
Position the pointer over the edge of the ROI, right-click, and select Add Vertex from the context menu.
Remove the most recently added vertex but keep drawing. Press Backspace. The function redraws the line from the previous vertex to the current position of the pointer. You can only back up to the first vertex you drew. Resize (reshape) the ROI Position pointer over a vertex and then click and drag.
Add a new vertex to the ROI and then click and drag.
Remove a vertex. The ROI redraws the line connecting the two neighboring vertices.
Move the ROI. Position the pointer over the ROI (not on a vertex). The pointer changes to a fleur shape. Click and drag to move the ROI. Delete the ROI. Position the pointer anywhere on the ROI and right-click. Select Delete Polygon from the context menu. You can also delete the ROI using the deletefunction.The
drawpolygonfunction creates aPolygonobject. After you create the object, you can modify the shape, position, appearance, and behavior of the ROI by using these object capabilities.Capability Support Object properties ROI objects have properties that specify their shape, position, appearance, and behavior. After you create the ROI object, change properties using dot notation.
For example, to change the color of the
roito yellow, set itsColorproperty:roi.Color = 'yellow'Object functions ROI objects have object functions that operate on the ROIs. For example, if you want to pause the MATLAB command line after creating an ROI, use the waitfunction.Event notifications ROI objects can notify your code when certain events occur, such as when the ROI is clicked or when the ROI is being moved. To receive event notifications, set up listeners. When the ROI notifies your application through the listener, it returns data specific to the event. For example, with the
ROIMovedevent, the ROI object returns its previous position and its current position. You can specify a callback function that executes when an event occurs.For an example of using event listeners with the
Polygonobject, see Set Up Listener for Polygon ROI Events.