Main Content

play

Play point clouds from lidar data object

Since R2024b

Description

play(lidarData) plays the point clouds from the lidar data object lidarData.

example

play(lidarData,Name=Value) specifies options using one or more name-value arguments. For example, WaitTime=0.5 plays the point clouds with a 0.5 second delay between point clouds.

axesHandle = play(___) returns a figure handle as an Axes object using any combination of input arguments from previous syntaxes.

Note

This function requires the Scenario Builder for Automated Driving Toolbox™ support package. You can install the Scenario Builder for Automated Driving Toolbox support package from the Add-On Explorer. For more information about installing add-ons, see Get and Manage Add-Ons.

Examples

collapse all

Specify a path containing a sequence of point cloud files.

files = dir(fullfile(toolboxdir("vision"),"visiondata","pcdmapseq","*.pcd"));
pcds = strcat({files.folder},filesep,{files.name})';

Specify timestamps for each point cloud in the point cloud data.

timestamps = (1:4)';

Create an empty lidar data object.

lidarData = scenariobuilder.LidarData(Name="LidarSensor")
lidarData = 
  LidarData with properties:

                Name: "LidarSensor"

          NumSamples: 0
            Duration: 0
          SampleRate: 0
          SampleTime: 0
          Timestamps: []

         PointClouds: []
    SensorParameters: []

          Attributes: []

Add your data samples to the lidar data object.

add(lidarData,timestamps,pcds)

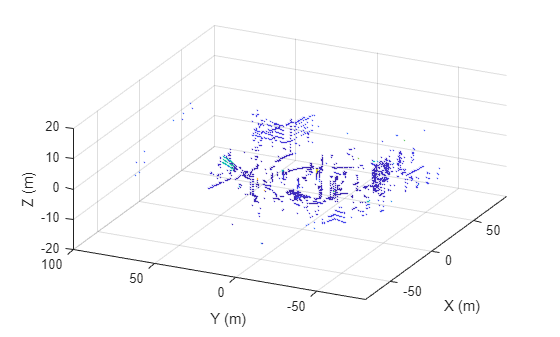
Visualize the lidar data object.

play(lidarData)

Input Arguments

collapse all

Lidar data, specified as a LidarData object.

Name-Value Arguments

Specify optional pairs of arguments as Name1=Value1,...,NameN=ValueN, where Name is the argument name and Value is the corresponding value. Name-value arguments must appear after other arguments, but the order of the pairs does not matter.

Example: play(lidarData,WaitTime=0.5) plays the point clouds with a 0.5 second delay between point clouds.

Parent figure, specified as a Figure object or Panel object. If you do not specify Parent, the function plays the point cloud data in a new figure.

Delay between playing point clouds, specified as a nonnegative scalar. Units are in seconds.

Custom plot function, specified as a function handle.

The function must support this syntax:

pcOut = plotFunction(axesHandle,pcIn,idx,obj),
where:

  • axesHandle — Figure handle of the axes on which to plot the point clouds.

  • pcIn — Input point cloud, specified as a pointCloud object.

  • idx — Index of the input point cloud, specified as an integer.

  • obj — Lidar data, specified as a LidarData object.

The pcOut output argument returns the processed input point cloud, returned as a pointCloud object with the same number of points as the input point cloud pcIn.

Point cloud property for the color map, specified as "auto", "Intensity", "Color", "X", "Y", or "Z". The play function uses the value of ColorSource to assign a color map for rendering the point cloud. The values set the color map using these properties:

  • "Intensity"Intensity property of the input point cloud.

  • "Color"Color property of the input point cloud.

  • "X"x-coordinates in the Location property of the input point cloud.

  • "Y"y-coordinates in the Location property of the input point cloud.

  • "Z"z-coordinates in the Location property of the input point cloud.

When you set ColorSource to "auto", the function sets the color map depending on which property values are available in the input point cloud object:

Available Point Cloud PropertyColor Source
Location only Maps the z-coordinate value to a color value in the current color map.
Location and Intensity Maps the z-coordinate value to a color value in the current color map.
Location and Color Maps the Color values to the current color map.
Location, Intensity, and Color Maps the Color values to the current color map.

Output Arguments

collapse all

Figure handle, returned as an Axes object.

Version History

Introduced in R2024b