Visualize Deep Neural Networks
Monitor training progress using built-in plots of network accuracy and loss. Investigate trained networks using visualization techniques such as Grad-CAM, occlusion sensitivity, LIME, and deep dream.
Apps
| Deep Network Designer | Design and visualize deep learning networks |
Functions
Properties
| ConfusionMatrixChart Properties | Confusion matrix chart appearance and behavior |
| ROCCurve Properties | Receiver operating characteristic (ROC) curve appearance and behavior (Since R2022b) |
Topics
Interpretability
- Deep Learning Visualization Methods
Learn about and compare deep learning visualization methods. - Understand Network Predictions Using Occlusion
This example shows how to use occlusion sensitivity maps to understand why a deep neural network makes a classification decision. - Investigate Spectrogram Classifications Using LIME
This example shows how to use locally interpretable model-agnostic explanations (LIME) to investigate the robustness of a deep convolutional neural network trained to classify spectrograms. - Investigate Classification Decisions Using Gradient Attribution Techniques
This example shows how to use gradient attribution maps to investigate which parts of an image are most important for classification decisions made by a deep neural network. - Investigate Network Predictions Using Class Activation Mapping
This example shows how to use class activation mapping (CAM) to investigate and explain the predictions of a deep convolutional neural network for image classification. - Visualize Image Classifications Using Maximal and Minimal Activating Images
This example shows how to use a data set to find out what activates the channels of a deep neural network. - View Network Behavior Using tsne
This example shows how to use thetsnefunction to view activations in a trained network. - Visualize Activations of a Convolutional Neural Network
This example shows how to feed an image to a convolutional neural network and display the activations of different layers of the network. - Visualize Features of a Convolutional Neural Network
This example shows how to visualize the features learned by convolutional neural networks.
Training Progress and Performance
- Classify Webcam Images Using Deep Learning
This example shows how to classify images from a webcam in real time using the pretrained deep convolutional neural network GoogLeNet. - Monitor Deep Learning Training Progress
This example shows how to monitor the training progress of deep learning networks. - Monitor Custom Training Loop Progress
Track and plot custom training loop progress. - Monitor GAN Training Progress and Identify Common Failure Modes
Learn how to diagnose and fix some of the most common failure modes in GAN training. - ROC Curve and Performance Metrics
Userocmetricsto examine the performance of a classification algorithm on a test data set. - Compare Deep Learning Models Using ROC Curves
This example shows how to use receiver operating characteristic (ROC) curves to compare the performance of deep learning models.
Featured Examples
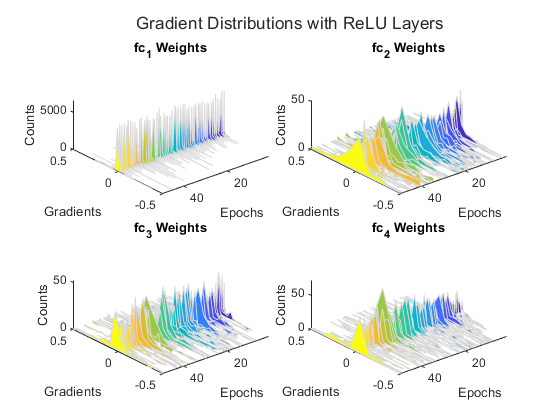
Detect Vanishing Gradients in Deep Neural Networks by Plotting Gradient Distributions
Monitor vanishing gradients while training a deep neural network.

Explore Network Predictions Using Deep Learning Visualization Techniques
Investigate network predictions using deep learning visualization techniques.
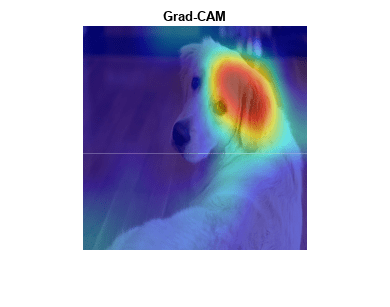
Grad-CAM Reveals the Why Behind Deep Learning Decisions
Use the gradient-weighted class activation mapping (Grad-CAM) technique to understand why a deep learning network makes its classification decisions. Grad-CAM, invented by Selvaraju and coauthors [1], uses the gradient of the classification score with respect to the convolutional features determined by the network in order to understand which parts of the image are most important for classification. This example uses the GoogLeNet pretrained network for images.

Interpret Deep Learning Time-Series Classifications Using Grad-CAM
Use the gradient-weighted class activation mapping (Grad-CAM) technique to understand the classification decisions of a 1-D convolutional neural network trained on time-series data.

Understand Network Predictions Using LIME
Use locally interpretable model-agnostic explanations (LIME) to understand why a deep neural network makes a classification decision.

Explore Semantic Segmentation Network Using Grad-CAM
Explore the predictions of a pretrained semantic segmentation network using Grad-CAM.
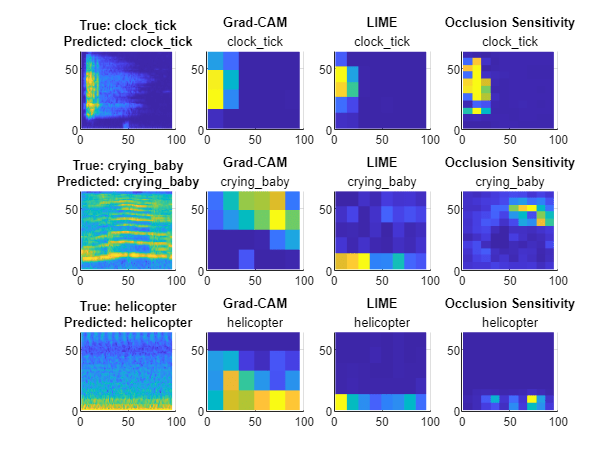
Investigate Audio Classifications Using Deep Learning Interpretability Techniques
Use interpretability techniques to investigate the predictions of a deep neural network trained to classify audio data.

Deep Dream Images Using GoogLeNet
Generate images using deepDreamImage with the pretrained convolutional neural network GoogLeNet.

Build Simple App For Deep Learning Inference Using App Designer
Use App Designer to create an app that can classify images using a deep neural network.
Select a Web Site
Choose a web site to get translated content where available and see local events and offers. Based on your location, we recommend that you select: United States.
You can also select a web site from the following list
Americas
- América Latina (Español)
- Canada (English)
- United States (English)
Europe
- Belgium (English)
- Denmark (English)
- Deutschland (Deutsch)
- España (Español)
- Finland (English)
- France (Français)
- Ireland (English)
- Italia (Italiano)
- Luxembourg (English)
- Netherlands (English)
- Norway (English)
- Österreich (Deutsch)
- Portugal (English)
- Sweden (English)
- Switzerland
- United Kingdom (English)
Asia Pacific
- Australia (English)
- India (English)
- New Zealand (English)
- 中国
- 日本Japanese (日本語)
- 한국Korean (한국어)