Main Content

rocmetrics

Receiver operating characteristic (ROC) curve and performance metrics for binary and multiclass classifiers

Since R2022b

    Description

    Create a rocmetrics object to evaluate the performance of a classification model using receiver operating characteristic (ROC) curves or other performance metrics. rocmetrics supports both binary and multiclass problems.

    For each class, rocmetrics computes performance metrics for a one-versus-all ROC curve. You can compute metrics for an average ROC curve by using the average function. After computing metrics for ROC curves, you can plot them by using the plot function.

    By default, rocmetrics computes the false positive rates (FPR) and the true positive rates (TPR) to obtain a ROC curve and the area under the ROC curve (AUC). You can compute additional metrics by specifying the AdditionalMetrics name-value argument when you create an object or by calling the addMetrics function after you create an object. A rocmetrics object stores the computed metrics and AUC values in the Metrics and AUC properties, respectively.

    rocmetrics computes pointwise confidence intervals for the performance metrics when you set the NumBootstraps value to a positive integer or when you specify cross-validated data for the true class labels (Labels), classification scores (Scores), and observation weights (Weights). For details, see Pointwise Confidence Intervals. Using confidence intervals requires Statistics and Machine Learning Toolbox™.

    Creation

    Description

    example

    rocObj = rocmetrics(Labels,Scores,ClassNames) creates a rocmetrics object using the true class labels in Labels and the classification scores in Scores. Specify Labels as a vector of length n, and specify Scores as a matrix of size n-by-K, where n is the number of observations, and K is the number of classes. ClassNames specifies the column order in Scores.

    The Metrics and AUC properties contain the performance metrics and AUC value for each class for which you specify Scores and ClassNames.

    If you specify cross-validated data in Labels and Scores as cell arrays, then rocmetrics computes confidence intervals for the performance metrics. Using cross-validated data requires Statistics and Machine Learning Toolbox.

    example

    rocObj = rocmetrics(Labels,Scores,ClassNames,Name=Value) specifies additional options using one or more name-value arguments. For example, Prior="uniform" sets all class probabilities to be equal.

    Input Arguments

    expand all

    True class labels, specified as a numeric vector, logical vector, categorical vector, character array, string array, or cell array of character vectors. You can also specify Labels as a cell array of one of these types for cross-validated data.

    • For data that is not cross-validated, the length of Labels and the number of rows in Scores must be equal.

    • For cross-validated data, you must specify Labels, Scores, and Weights as cell arrays with the same number of elements. rocmetrics treats an element in the cell arrays as data from one cross-validation fold and computes pointwise confidence intervals for the performance metrics. The length of Labels{i} and the number of rows in Scores{i} must be equal. Using cross-validated data requires Statistics and Machine Learning Toolbox.

    Each row of Labels or Labels{i} represents the true label of one observation.

    This argument sets the Labels property.

    Data Types: single | double | logical | char | string | cell

    Classification scores, specified as a numeric matrix or a cell array of numeric matrices.

    Each row of the matrix in Scores contains the classification scores of one observation for all classes specified in ClassNames. The column order of Scores must match the class order in ClassNames.

    • For a matrix input, Score(j,k) is the classification score of observation j for class ClassNames(k). For example, predict returns predicted class scores as an n-by-K matrix, where n is the number of observations and K is the number classes. Pass the output to rocmetrics.

      The number of rows in Scores and the length of Labels must be equal. rocmetrics adjusts scores for each class relative to the scores for the rest of the classes. For details, see Adjusted Scores for Multiclass Classification Problem.

    • For a vector input, Score(j) is the classification score of observation j for the class specified in ClassNames.

      • ClassNames must contain only one class.

      • Prior must be a two-element vector with Prior(1) representing the prior probability for the specified class.

      • Cost must be a 2-by-2 matrix containing [Cost(P|P),Cost(N|P);Cost(P|N),Cost(N|N)], where P is a positive class (the class for which you specify classification scores), and N is a negative class.

      • The length of Scores and the length of Labels must be equal.

      If you want to display the model operating point when you plot the ROC curve using the plot function, the values in Score(j) must be the posterior probability. This restriction applies only to a vector input.

    • For cross-validated data, you must specify Labels, Scores, and Weights as cell arrays with the same number of elements. rocmetrics treats an element in the cell arrays as data from one cross-validation fold and computes pointwise confidence intervals for the performance metrics. Score{i}(j,k) is the classification score of observation j in element i for class ClassNames(k). The number of rows in Scores{i} and the length of Labels{i} must be equal. Using cross-validated data requires Statistics and Machine Learning Toolbox.

    For more information, see Classification Score Input for rocmetrics.

    This argument sets the Scores property.

    Data Types: single | double | cell

    Class names, specified as a numeric vector, logical vector, categorical vector, character array, string array, or cell array of character vectors. ClassNames must have the same data type as the true labels in Labels. The values in ClassNames must appear in Labels.

    • If you specify classification scores for only one class in Scores, ClassNames specifies only the name of this class.

    • Otherwise, ClassNames specifies the order of the classes in Scores, Cost, and Prior.

    This argument sets the ClassNames property.

    Data Types: single | double | logical | cell | categorical

    Name-Value Arguments

    Specify optional pairs of arguments as Name1=Value1,...,NameN=ValueN, where Name is the argument name and Value is the corresponding value. Name-value arguments must appear after other arguments, but the order of the pairs does not matter.

    Example: FixedMetric="FalsePositiveRate",FixedMetricValues=0:0.01:1 holds the FPR values fixed at 0:0.01:1.

    Performance Metrics

    expand all

    Additional model performance metrics to compute, specified as a character vector or string scalar of the built-in metric name, string array of names, function handle (@metricName), or cell array of names or function handles. A rocmetrics object always computes the false positive rates (FPR) and the true positive rates (TPR) to obtain a ROC curve. Therefore, you do not have to specify to compute FPR and TPR.

    • Built-in metrics — Specify one of the following built-in metric names by using a character vector or string scalar. You can specify more than one by using a string array.

      NameDescription
      "TruePositives" or "tp"Number of true positives (TP)
      "FalseNegatives" or "fn"Number of false negatives (FN)
      "FalsePositives" or "fp"Number of false positives (FP)
      "TrueNegatives" or "tn"Number of true negatives (TN)
      "SumOfTrueAndFalsePositives" or "tp+fp"Sum of TP and FP
      "RateOfPositivePredictions" or "rpp"Rate of positive predictions (RPP), (TP+FP)/(TP+FN+FP+TN)
      "RateOfNegativePredictions" or "rnp"Rate of negative predictions (RNP), (TN+FN)/(TP+FN+FP+TN)
      "Accuracy" or "accu"Accuracy, (TP+TN)/(TP+FN+FP+TN)
      "FalseNegativeRate", "fnr", or "miss"False negative rate (FNR), or miss rate, FN/(TP+FN)
      "TrueNegativeRate", "tnr", or "spec"True negative rate (TNR), or specificity, TN/(TN+FP)
      "PositivePredictiveValue", "ppv", or "prec"Positive predictive value (PPV), or precision, TP/(TP+FP)
      "NegativePredictiveValue" or "npv"Negative predictive value (NPV), TN/(TN+FN)
      "ExpectedCost" or "ecost"

      Expected cost, (TP*cost(P|P)+FN*cost(N|P)+FP*cost(P|N)+TN*cost(N|N))/(TP+FN+FP+TN), where cost is a 2-by-2 misclassification cost matrix containing [0,cost(N|P);cost(P|N),0]. cost(N|P) is the cost of misclassifying a positive class (P) as a negative class (N), and cost(P|N) is the cost of misclassifying a negative class as a positive class.

      The software converts the K-by-K matrix specified by the Cost name-value argument of rocmetrics to a 2-by-2 matrix for each one-versus-all binary problem. For details, see Misclassification Cost Matrix.

      The software computes the scale vector using the prior class probabilities (Prior) and the number of classes in Labels, and then scales the performance metrics according to this scale vector. For details, see Performance Metrics.

    • Custom metric — Specify a custom metric by using a function handle. A custom function that returns a performance metric must have this form:

      metric = customMetric(C,scale,cost)

      • The output argument metric is a scalar value.

      • A custom metric is a function of the confusion matrix (C), scale vector (scale), and cost matrix (cost). The software finds these input values for each one-versus-all binary problem. For details, see Performance Metrics.

        • C is a 2-by-2 confusion matrix consisting of [TP,FN;FP,TN].

        • scale is a 2-by-1 scale vector.

        • cost is a 2-by-2 misclassification cost matrix.

      The software does not support cross-validation for a custom metric. Instead, you can specify to use bootstrap when you create a rocmetrics object.

    Note that the positive predictive value (PPV) is NaN for the reject-all threshold for which TP = FP = 0, and the negative predictive value (NPV) is NaN for the accept-all threshold for which TN = FN = 0. For more details, see Thresholds, Fixed Metric, and Fixed Metric Values.

    Example: AdditionalMetrics=["Accuracy","PositivePredictiveValue"]

    Example: AdditionalMetrics={"Accuracy",@m1,@m2} specifies the accuracy metric and the custom metrics m1 and m2 as additional metrics. rocmetrics stores the custom metric values as variables named CustomMetric1 and CustomMetric2 in the Metrics property.

    Data Types: char | string | cell | function_handle

    Fixed metric, specified as "Thresholds", "FalsePositiveRate" (or "fpr"), "TruePositiveRate" (or "tpr"), or a metric specified by the AdditionalMetrics name-value argument. To hold a custom metric fixed, specify FixedMetric as "CustomMetricN", where N is the number that refers to the custom metric. For example, specify "CustomMetric1" to use the first custom metric specified by AdditionalMetrics as the fixed metric.

    rocmetrics finds the ROC curves and other metric values that correspond to the fixed values (FixedMetricValues) of the fixed metric (FixedMetric), and stores the values in the Metrics property as a table. For more details, see Thresholds, Fixed Metric, and Fixed Metric Values.

    If rocmetrics computes confidence intervals, it uses one of two methods for the computation, depending on the FixedMetric value:

    • If FixedMetric is "Thresholds" (default), rocmetrics uses threshold averaging.

    • If FixedMetric is a nondefault value, rocmetrics uses vertical averaging.

    For details, see Pointwise Confidence Intervals.

    Using confidence intervals requires Statistics and Machine Learning Toolbox.

    Example: FixedMetric="TruePositiveRate"

    Data Types: char | string

    Values for the fixed metric (FixedMetric), specified as "all" or a numeric vector.

    rocmetrics finds the ROC curves and other metric values that correspond to the fixed values (FixedMetricValues) of the fixed metric (FixedMetric), and stores the values in the Metrics property as a table.

    The default FixedMetric value is "Thresholds", and the default FixedMetricValues value is "all". For each class, rocmetrics uses all distinct adjusted score values as threshold values and computes the performance metrics using the threshold values. Depending on the UseNearestNeighbor setting, rocmetrics uses the exact threshold values corresponding to the fixed values or the nearest threshold values. For more details, see Thresholds, Fixed Metric, and Fixed Metric Values.

    If rocmetrics computes confidence intervals, it holds FixedMetric fixed at FixedMetricValues.

    • FixedMetric value is "Thresholds", and FixedMetricValues is "all"rocmetrics computes confidence intervals at the values corresponding to all distinct threshold values.

    • FixedMetric value is a performance metric, and FixedMetricValues is "all"rocmetrics finds the metric values corresponding to all distinct threshold values, and computes confidence intervals at the values corresponding to the metric values.

    For details, see Pointwise Confidence Intervals. Using confidence intervals requires Statistics and Machine Learning Toolbox.

    Example: FixedMetricValues=0:0.01:1

    Data Types: single | double

    NaN condition, specified as "omitnan" or "includenan".

    • "omitnan"rocmetrics ignores all NaN score values in the input Scores and the corresponding values in Labels and Weights.

    • "includenan"rocmetrics uses the NaN score values in the input Scores for the calculation. The function adds the observations with NaN scores to false classification counts in the respective class. That is, the function counts observations with NaN scores from the positive class as false negative (FN), and counts observations with NaN scores from the negative class as false positive (FP).

    For more details, see NaN Score Values.

    Example: NaNFlag="includenan"

    Data Types: char | string

    Indicator to use the nearest metric values, specified as logical 0 (false) or 1 (true).

    • logical 0 (false) — rocmetrics uses the exact threshold values corresponding to the specified fixed metric values in FixedMetricValues for FixedMetric.

    • logical 1 (true) — Among the adjusted input scores, rocmetrics finds a value that is the nearest to the threshold value corresponding to each specified fixed metric value.

    For more details, see Thresholds, Fixed Metric, and Fixed Metric Values.

    The UseNearestNeighbor value must be false if rocmetrics computes confidence intervals. Otherwise, the default value is true.

    Using confidence intervals requires Statistics and Machine Learning Toolbox.

    Example: UseNearestNeighbor=false

    Data Types: logical

    Options for Classification Model

    expand all

    Since R2024a

    Flag to apply misclassification costs to scores for appropriate models, specified as a numeric or logical 0 (false) or 1 (true). Set ApplyCostToScores to true only when you specify scores for a k-nearest neighbor (KNN), discriminant analysis, or naive Bayes model with nondefault misclassification costs. These models use expected classification costs rather than scores to predict labels.

    If you specify ApplyCostToScores as true, the software changes the scores to S*(-C), where the scores S are specified by the Scores argument, and the misclassification cost matrix C is specified by the Cost name-value argument. The rocmetrics object stores the transformed scores in the Scores property.

    If you specify ApplyCostToScores as false, the software stores the untransformed scores in the Scores property of the rocmetrics object.

    Example: ApplyCostToScores=true

    Data Types: single | double | logical

    Misclassification cost, specified as a K-by-K square matrix C, where K is the number of unique classes in Labels. C(i,j) is the cost of classifying a point into class j if its true class is i (that is, the rows correspond to the true class and the columns correspond to the predicted class). ClassNames specifies the order of the classes.

    rocmetrics converts the K-by-K matrix to a 2-by-2 matrix for each one-versus-all binary problem. For details, see Misclassification Cost Matrix.

    If you specify classification scores for only one class in Scores, the Cost value must be a 2-by-2 matrix containing [0,cost(N|P);cost(P|N),0], where P is a positive class (the class for which you specify classification scores), and N is a negative class. cost(N|P) is the cost of misclassifying a positive class as a negative class, and cost(P|N) is the cost of misclassifying a negative class as a positive class.

    The default value is C(i,j)=1 if i~=j, and C(i,j)=0 if i=j. The diagonal entries of a cost matrix must be zero.

    This argument sets the Cost property.

    Note

    If you specify a misclassification cost matrix when you use scores for a KNN, discriminant analysis, or naive Bayes model, set ApplyCostToScores to true. These models use expected classification costs rather than scores to predict labels. (since R2024a)

    Example: Cost=[0 2;1 0]

    Data Types: single | double

    Prior class probabilities, specified as one of the following:

    • "empirical" determines class probabilities from class frequencies in the true class labels Labels. If you pass observation weights (Weights), rocmetrics also uses the weights to compute the class probabilities.

    • "uniform" sets all class probabilities to be equal.

    • Vector of scalar values, with one scalar value for each class. ClassNames specifies the order of the classes.

      If you specify classification scores for only one class in Scores, the Prior value must be a two-element vector with Prior(1) representing the prior probability for the specified class.

    This argument sets the Prior property.

    Example: Prior="uniform"

    Data Types: single | double | char | string

    Observation weights, specified as a numeric vector of positive values or a cell array containing numeric vectors of positive values.

    • For data that is not cross-validated, specify Weights as a numeric vector that has the same length as Labels.

    • For cross-validated data, you must specify Labels, Scores, and Weights as cell arrays with the same number of elements. rocmetrics treats an element in the cell arrays as data from one cross-validation fold and computes pointwise confidence intervals for the performance metrics. The length of Weights{i} and the length of Labels{i} must be equal. Using cross-validated data requires Statistics and Machine Learning Toolbox.

    rocmetrics weighs the observations in Labels and Scores with the corresponding values in Weights. If you set the NumBootstraps value to a positive integer, rocmetrics draws samples with replacement, using the weights as multinomial sampling probabilities. Using the NumBootstraps name-value argument requires Statistics and Machine Learning Toolbox.

    By default, Weights is a vector of ones or a cell array containing vectors of ones.

    This argument sets the Weights property.

    Data Types: single | double | cell

    Options for Confidence Intervals

    expand all

    Significance level for the pointwise confidence intervals, specified as a scalar in the range (0,1).

    If you specify Alpha as α, then rocmetrics computes 100×(1 – α)% pointwise confidence intervals for the performance metrics.

    This argument is related to computing confidence intervals. Therefore, it is valid only when you specify cross-validated data for Labels, Scores, and Weights, or when you set the NumBootstraps value to a positive integer.

    This option requires Statistics and Machine Learning Toolbox.

    Example: Alpha=0.01 specifies 99% confidence intervals.

    Data Types: single | double

    Bootstrap options for parallel computation, specified as a structure.

    You can specify options for computing bootstrap iterations in parallel and setting random numbers during the bootstrap sampling. Create the BootstrapOptions structure with statset (Statistics and Machine Learning Toolbox). This table lists the option fields and their values.

    Field NameField ValueDefault
    UseParallel

    Set this value to true to compute bootstrap iterations in parallel.

    false
    UseSubstreams

    Set this value to true to run computations in parallel in a reproducible manner.

    To compute reproducibly, set Streams to a type that allows substreams: "mlfg6331_64" or "mrg32k3a".

    false
    Streams

    Specify this value as a RandStream object or cell array of such objects. Use a single object except when the UseParallel value is true and the UseSubstreams value is false. In that case, use a cell array that has the same size as the parallel pool.

    If you do not specify Streams, then rocmetrics uses the default stream or streams.

    This argument is valid only when you specify NumBootstraps as a positive integer to compute confidence intervals using bootstrapping.

    This option requires Statistics and Machine Learning Toolbox, and parallel computation requires Parallel Computing Toolbox™.

    Example: BootstrapOptions=statset(UseParallel=true)

    Data Types: struct

    Bootstrap confidence interval type, specified as one of the values in this table.

    ValueDescription
    "bca"

    Bias corrected and accelerated percentile method [8][9]. This method Involves a z0 factor computed using the proportion of bootstrap values that are less than the original sample value. To produce reasonable results when the sample is lumpy, the software computes z0 by including half of the bootstrap values that are the same as the original sample value.

    "corrected percentile" or "cper"Bias corrected percentile method [10]
    "normal" or "norm" Normal approximated interval with bootstrapped bias and standard error [11]
    "percentile" or "per"Basic percentile method
    "student" or "stud"Studentized confidence interval [8]

    This argument is valid only when you specify NumBootstraps as a positive integer to compute confidence intervals using bootstrapping.

    This option requires Statistics and Machine Learning Toolbox.

    Example: BootstrapType="student"

    Data Types: char | string

    Number of bootstrap samples to draw for computing pointwise confidence intervals, specified as a nonnegative integer scalar.

    If you specify NumBootstraps as a positive integer, then rocmetrics uses NumBootstraps bootstrap samples. To create each bootstrap sample, the function randomly selects n out of the n rows of input data with replacement. The default value 0 implies that rocmetrics does not use bootstrapping.

    rocmetrics computes confidence intervals by using either cross-validated data or bootstrap samples. Therefore, if you specify cross-validated data for Labels, Scores, and Weights, then NumBootstraps must be 0.

    For details, see Pointwise Confidence Intervals.

    This option requires Statistics and Machine Learning Toolbox.

    Example: NumBootstraps=500

    Data Types: single | double

    Number of bootstrap samples to draw for the studentized standard error estimate, specified as a positive integer scalar.

    This argument is valid only when you specify NumBootstraps as a positive integer and BootstrapType as "student" to compute studentized bootstrap confidence intervals. rocmetrics estimates the studentized standard error estimate by using NumBootstrapsStudentizedSE bootstrap data samples.

    This option requires Statistics and Machine Learning Toolbox.

    Example: NumBootstrapsStudentizedSE=500

    Data Types: single | double

    Properties

    expand all

    Performance Metrics

    This property is read-only.

    Area under the ROC curve (AUC), specified as a numeric vector or matrix.

    rocmetrics computes the AUC for each one-versus-all ROC curve (that is, for each class). The column order of the AUC property value matches the class order in ClassNames.

    For a binary problem where you specify Scores as a two-column matrix, this property is a 1-by-2 vector containing identical AUC values. The AUC values are identical because the overall model performance on one class is identical to the performance on the other class for a binary problem.

    If rocmetrics computes confidence intervals for AUC, the AUC property value is a matrix in which the first row corresponds to the AUC values, and the second and third rows correspond to the lower and upper bounds, respectively. rocmetrics computes confidence intervals for AUC if the function also computes confidence intervals for the performance metrics and you set FixedMetric to "Thresholds" (default), "FalsePositiveRate", or "TruePositiveRate". Using confidence intervals requires Statistics and Machine Learning Toolbox.

    Data Types: single | double

    This property is read-only.

    Performance metrics, specified as a table.

    The table contains performance metric values for all classes, vertically concatenated according to the class order in ClassNames. The table has a row for each unique threshold value for each class. rocmetrics determines the threshold values to use based on the value of FixedMetric, FixedMetricValues, and UseNearestNeighbor. For details, see Thresholds, Fixed Metric, and Fixed Metric Values.

    The number of rows for each class in the table is the number of unique threshold values.

    Each row of the table contains these variables: ClassName, Threshold, FalsePositiveRate, and TruePositiveRate, as well as a variable for each additional metric specified in AdditionalMetrics. If you specify a custom metric, rocmetrics names the metric "CustomMetricN", where N is the number that refers to the custom metric. For example, "CustomMetric1" corresponds to the first custom metric specified by AdditionalMetrics.

    Each variable in the Metrics table contains a vector or a three-column matrix.

    • If rocmetrics does not compute confidence intervals, each variable contains a vector.

    • If rocmetrics computes confidence intervals, both ClassName and the variable for FixedMetric (Threshold, FalsePositiveRate, TruePositiveRate, or an additional metric) contain a vector, and the other variables contain a three-column matrix. The first column of the matrix corresponds to the metric values, and the second and third columns correspond to the lower and upper bounds, respectively.

      Using confidence intervals requires Statistics and Machine Learning Toolbox.

    Data Types: table

    Classification Model Properties

    You can specify the following properties when creating a rocmetrics object.

    This property is read-only.

    Class names, specified as a numeric vector, logical vector, categorical vector, or cell array of character vectors.

    For details, see the input argument ClassNames, which sets this property. (The software treats character or string arrays as cell arrays of character vectors.)

    Data Types: single | double | logical | cell | categorical

    This property is read-only.

    Misclassification cost, specified as a square matrix.

    For details, see the Cost name-value argument, which sets this property.

    Data Types: single | double

    This property is read-only.

    True class labels, specified as a numeric vector, logical vector, categorical vector, cell array of character vectors, or cell array of one of these types for cross-validated data.

    For details, see the input argument Labels, which sets this property. (The software treats character or string arrays as cell arrays of character vectors.)

    Data Types: single | double | logical | cell | categorical

    This property is read-only.

    Prior class probabilities, specified as a numeric vector.

    For details, see the Prior name-value argument, which sets this property. If you specify this argument as a character vector or string scalar ("empirical" or "uniform"), rocmetrics computes the prior probabilities and stores the Prior property as a numeric vector.

    Data Types: single | double

    This property is read-only.

    Classification scores, specified as a numeric matrix or a cell array of numeric matrices.

    For details, see the input argument Scores, which sets this property.

    Note

    If you specify the ApplyCostToScores name-value argument as true, the software stores the transformed scores S*(-C), where the scores S are specified by the Scores argument, and the misclassification cost matrix C is specified by the Cost name-value argument. (since R2024a)

    Data Types: single | double | cell

    This property is read-only.

    Observation weights, specified as a numeric vector of positive values or a cell array containing numeric vectors of positive values.

    For details, see the Weights name-value argument, which sets this property.

    Data Types: single | double | cell

    Object Functions

    addMetricsCompute additional classification performance metrics
    averageCompute performance metrics for average receiver operating characteristic (ROC) curve in multiclass problem
    plotPlot receiver operating characteristic (ROC) curves and other performance curves

    Examples

    collapse all

    Load a sample of predicted classification scores and true labels for a classification problem.

    load('flowersDataResponses.mat')

    trueLabels is the true labels for an image classification problem and scores is the softmax prediction scores. scores is an N-by-K array where N is the number of observations and K is the number of classes.

    trueLabels = flowersData.trueLabels;
    scores = flowersData.scores;

    Load the class names. The column order of scores follows the class order stored in classNames.

    classNames = flowersData.classNames;

    Create a rocmetrics object by using the true labels in trueLabels and the classification scores in scores. Specify the column order of scores using classNames.

    rocObj = rocmetrics(trueLabels,scores,classNames);

    rocObj is a rocmetrics object that stores the AUC values and performance metrics for each class in the AUC and Metrics properties. Display the AUC property.

    rocObj.AUC
    ans = 1x5 single row vector
    
        0.9781    0.9889    0.9728    0.9809    0.9732
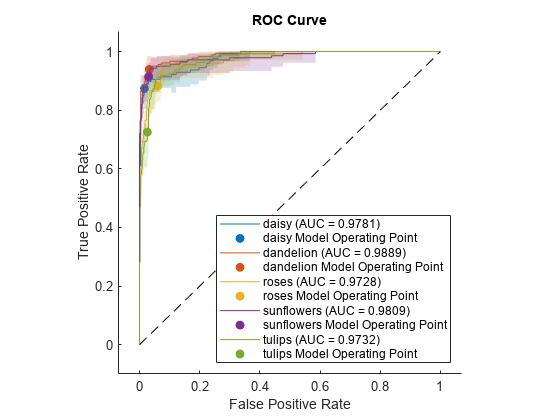


    Plot the ROC curve for each class.

    plot(rocObj)

    The filled circle markers indicate the model operating points. The legend displays the class name and AUC value for each curve.

    Plot the macro average ROC curve.

    plot(rocObj,AverageROCType=["macro"],ClassNames=[])

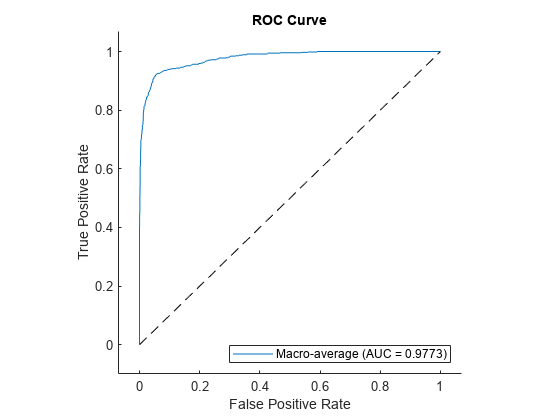
    Compute the confidence intervals for FPR and TPR for fixed threshold values by using bootstrap samples, and plot the confidence intervals for TPR on the ROC curve by using the plot function. This examples requires Statistics and Machine Learning Toolbox™.

    Load a sample of true labels and the prediction scores for a classification problem. For this example, there are five classes: daisy, dandelion, roses, sunflowers, and tulips. The class names are stored in classNames. The scores are the softmax prediction scores generated using the predict function. scores is an N-by-K array where N is the number of observations and K is the number of classes. The column order of scores follows the class order stored in classNames.

    load('flowersDataResponses.mat')
    
    scores = flowersData.scores;
    trueLabels = flowersData.trueLabels;
    predLabels = flowersData.predictedLabels;
    
    classNames = flowersData.classNames;

    Create a rocmetrics object by using the true labels in trueLabels and the classification scores in scores. Specify the column order of scores using classNames. Specify NumBootstraps as 100 to use 100 bootstrap samples to compute the confidence intervals.

    rocObj = rocmetrics(trueLabels,scores,classNames,NumBootstraps=100);

    Find the rows for the second class in the table of the Metrics property, and display the first eight rows.

    idx = rocObj.Metrics.ClassName ==classNames(2);
    head(rocObj.Metrics(idx,:))
        ClassName    Threshold    FalsePositiveRate          TruePositiveRate       
        _________    _________    _________________    _____________________________
    
        dandelion        1           0    0    0             0          0          0
        dandelion        1           0    0    0       0.23889    0.17858    0.31326
        dandelion        1           0    0    0       0.26111    0.20107    0.34007
        dandelion        1           0    0    0       0.27222    0.21829    0.35778
        dandelion        1           0    0    0       0.28889    0.22739    0.36583
        dandelion        1           0    0    0       0.29444    0.23682    0.41685
        dandelion        1           0    0    0           0.3    0.24296    0.42567
        dandelion        1           0    0    0       0.31111    0.24964    0.42614
    

    Each row of the table contains the metric value and its confidence intervals for FPR and TPR for a fixed threshold value. The Threshold variable is a column vector, and the FalsePositiveRate and TruePositiveRate variables are three-column matrices. The first column of the matrices corresponds to the metric values, and the second and third columns correspond to the lower and upper bounds, respectively.

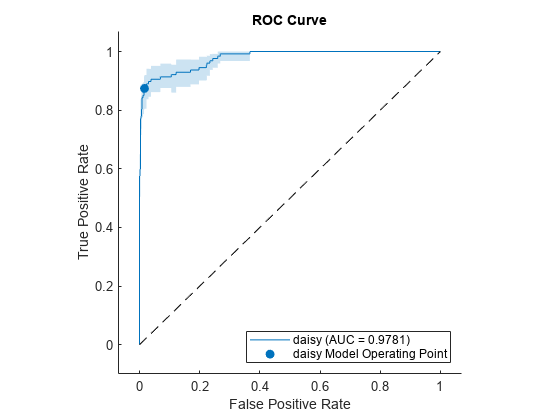
    Plot the ROC curve and the confidence intervals for TPR. Specify ShowConfidenceIntervals=true to show the confidence intervals.

    plot(rocObj,ShowConfidenceIntervals=true)

    The shaded area around the ROC curve indicates the confidence intervals. The confidence intervals represent the uncertainty of the curve due to the variance in the data set for the trained model.

    Specify one class to plot by using the ClassNames name-value argument.

    plot(rocObj,ShowConfidenceIntervals=true,ClassNames="daisy")

    More About

    expand all

    Algorithms

    expand all

    References

    [1] Fawcett, T. “ROC Graphs: Notes and Practical Considerations for Researchers”, Machine Learning 31, no. 1 (2004): 1–38.

    [2] Zweig, M., and G. Campbell. “Receiver-Operating Characteristic (ROC) Plots: A Fundamental Evaluation Tool in Clinical Medicine.” Clinical Chemistry 39, no. 4 (1993): 561–577.

    [3] Davis, J., and M. Goadrich. “The Relationship Between Precision-Recall and ROC Curves.” Proceedings of ICML ’06, 2006, pp. 233–240.

    [4] Moskowitz, C. S., and M. S. Pepe. “Quantifying and Comparing the Predictive Accuracy of Continuous Prognostic Factors for Binary Outcomes.” Biostatistics 5, no. 1 (2004): 113–27.

    [5] Huang, Y., M. S. Pepe, and Z. Feng. “Evaluating the Predictiveness of a Continuous Marker.” U. Washington Biostatistics Paper Series, 2006, 250–61.

    [6] Briggs, W. M., and R. Zaretzki. “The Skill Plot: A Graphical Technique for Evaluating Continuous Diagnostic Tests.” Biometrics 64, no. 1 (2008): 250–256.

    [7] Bettinger, R. “Cost-Sensitive Classifier Selection Using the ROC Convex Hull Method.” SAS Institute, 2003.

    [8] DiCiccio, Thomas J., and Bradley Efron. “Bootstrap Confidence Intervals.” Statistical Science 11, no. 3 (1996): 189–228.

    [9] Efron, Bradley, and Robert J. Tibshirani. An Introduction to the Bootstrap. New York: Chapman & Hall, 1993.

    [10] Efron, Bradley. The Jackknife, the Bootstrap and Other Resampling Plans. Philadelphia: The Society for Industrial and Applied Mathematics, 1982.

    [11] Davison, A. C., and D. V. Hinkley. Bootstrap Methods and Their Applications. Cambridge University Press, 1997.

    Version History

    Introduced in R2022b

    expand all