spy
Visualize sparsity pattern of a sparse model
Syntax
Description
spy( plots the sparsity pattern of the
sparse model sys)sys, which can be a first-order
(sparss) or second-order (mechss) model. The
plot displays the number of nonzero elements in each sparse matrix of
sys. To display a matrix, right click the plot and select the desired matrix.
Examples
For this example, consider sparseFOContinuous.mat which contains sparse matrices for a continuous-time sparse first-order state-space model.
Extract the sparse matrices from sparseFOContinuous.mat.
load('sparseFOContinuous.mat','A','B','C','D','E');
Create the sparss model object.
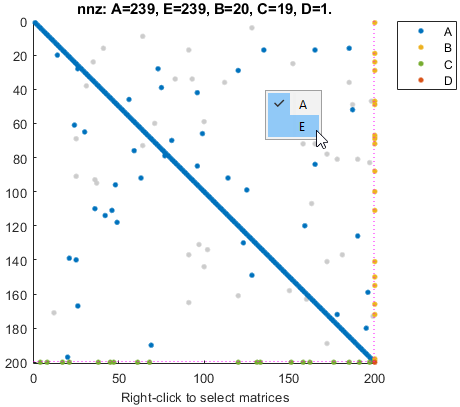
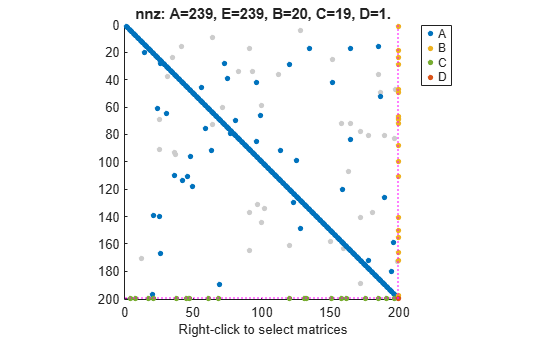
sys = sparss(A,B,C,D,E)
Sparse continuous-time state-space model with 1 outputs, 1 inputs, and 199 states.
Model Properties

Use "spy" and "showStateInfo" to inspect model structure.
Type "help sparssOptions" for available solver options for this model.
The output sys is a continuous-time sparss model object with 199 states, 1 input and 1 output.
You can use the spy command to visualize the sparsity of the sparss model object.
spy(sys)
For this example, consider sparseFODiscrete.mat which contains sparse matrices for a discrete-time sparse first-order state-space model.
Extract the sparse matrices from sparseFODiscrete.mat.
load('sparseFODiscrete.mat','A','B','C','D','E','ts');
Create the sparss model object.
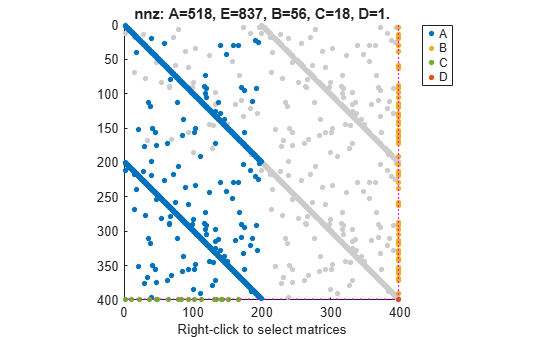
sys = sparss(A,B,C,D,E,ts)
Sparse discrete-time state-space model with 1 outputs, 1 inputs, and 398 states.
Model Properties

Use "spy" and "showStateInfo" to inspect model structure.
Type "help sparssOptions" for available solver options for this model.
The output sys is a discrete-time sparss model object with 398 states, 1 input and 1 output.
You can use the spy command to visualize the sparsity of the sparss model object.
spy(sys)
You can also view model properties of the sparss model object.
properties('sparss')Properties for class sparss:
A
B
C
D
E
Offsets
Scaled
StateInfo
SolverOptions
InternalDelay
InputDelay
OutputDelay
InputName
InputUnit
InputGroup
OutputName
OutputUnit
OutputGroup
Notes
UserData
Name
Ts
TimeUnit
SamplingGrid
For this example, consider the sparse matrices for the 3-D beam model subjected to an impulsive point load at its tip in the file sparseBeam.mat.
Extract the sparse matrices from sparseBeam.mat.
load('sparseBeam.mat','M','K','B','F','G','D');
Create the mechss model object by specifying [] for matrix C, since there is no damping.
sys = mechss(M,[],K,B,F,G,D)
Sparse continuous-time second-order model with 3 outputs, 1 inputs, and 3408 degrees of freedom.
Model Properties

Use "spy" and "showStateInfo" to inspect model structure.
Type "help mechssOptions" for available solver options for this model.
The output sys is a mechss model object containing a 3-by-1 array of sparse models with 3408 degrees of freedom, 1 input, and 3 outputs.
You can use the spy command to visualize the sparsity of the mechss model object.
spy(sys)
For this example, consider the sparse matrices of the discrete system in the file discreteSOSparse.mat.
Load the sparse matrices from discreteSOSparse.mat.
load('discreteSOSparse.mat','M','C','K','B','F','G','D','ts');
Create the discrete-time mechss model object by specifying the sample time ts.
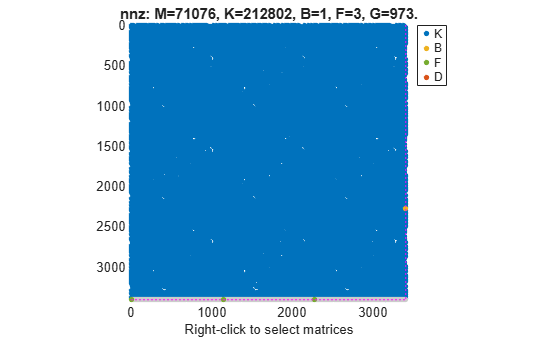
sys = mechss(M,C,K,B,F,G,D,ts)
Sparse discrete-time second-order model with 1 outputs, 1 inputs, and 28408 degrees of freedom.
Model Properties

Use "spy" and "showStateInfo" to inspect model structure.
Type "help mechssOptions" for available solver options for this model.
The output sys is a discrete-time mechss model object with 28408 degrees of freedom, 1 input, and 1 output.
You can use the spy command to visualize the sparsity pattern of the mechss model object. You can right-click on the plot to select matrices to be displayed.
spy(sys)
