stepplot
Plot step response of dynamic system
Description
The stepplot function plots the step response of a dynamic system
model and returns a
StepPlot chart object. To customize the plot, modify the properties of the
chart object using dot notation. For more information, see Customize Linear Analysis Plots at Command Line.
To obtain step response data, use the step function.
Creation
Syntax
Description
sp = stepplot(sys)sys and returns
the corresponding chart object.
If sys is a multi-input, multi-output (MIMO) model, then the
stepplot function creates a grid of plots with each plot displaying
the step response of one input-output pair.
If sys is a model with
complex coefficients, then the plot shows both the real and imaginary components of the
response on a single axes and indicates the imaginary component with a diamond marker.
You can also view the response using magnitude-phase and complex-plane plots. (since R2025a)
sp = stepplot(___,t)t. You can
use t with any of the input argument combinations in previous
syntaxes. To define the time steps, you can specify:
The final simulation time using a scalar value
The initial and final simulation times using a two-element vector (since R2023b)
All the time steps using a vector
sp = stepplot(___,config)RespConfig to create config.
sp = stepplot(___,plotoptions)plotoptions. Settings you specify in
plotoptions override the plotting preferences for the current
MATLAB® session. This syntax is useful when you want to write a script to generate
multiple plots that look the same regardless of the local preferences.
sp = stepplot(parent,___)Figure or TiledChartLayout, and sets the
Parent property. Use this syntax when you want to create a plot
in a specified open figure or when creating apps in App Designer.
Input Arguments
Properties
Object Functions
addResponse | Add dynamic system response to existing response plot |
showConfidence (System Identification Toolbox) | Display confidence regions on response plots for identified models |
Examples
For this example, use the plot handle to change the time units to minutes and turn on the grid.
Generate a random state-space model with 5 states and create the step response plot with chart object sp.
rng("default")
sys = rss(5);
sp = stepplot(sys);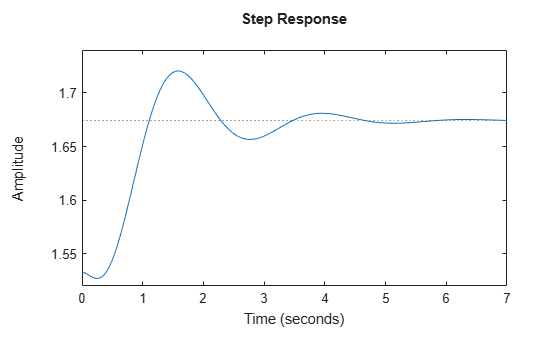
Change the time units to minutes and turn on the grid. To do so, edit properties of the chart object.
sp.TimeUnit = "minutes";
grid on;
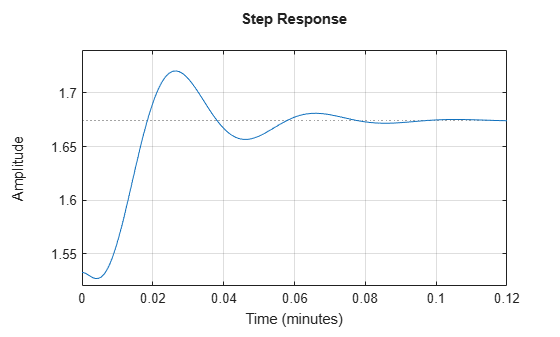
The step plot automatically updates when you modify the chart object.
Alternatively, you can also use the timeoptions command to specify the required plot options. First, create an options set based on the toolbox preferences.
plotoptions = timeoptions("cstprefs");Change properties of the options set by setting the time units to minutes and enabling the grid.
plotoptions.TimeUnits = 'minutes';
plotoptions.Grid = "on";
stepplot(sys,plotoptions);
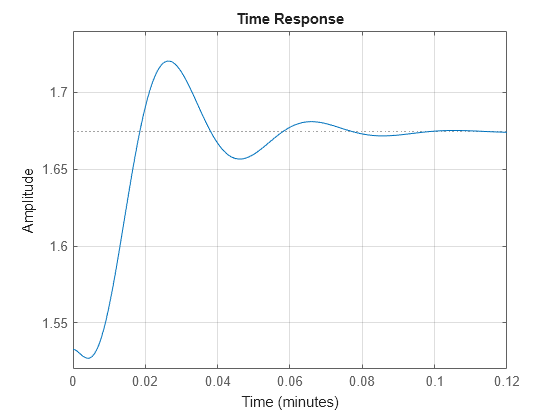
Depending on your own toolbox preferences, the plot you obtain might look different from this plot. Only the properties that you set explicitly, in this example TimeUnits and Grid, override the toolbox preferences.
Generate a step response plot for two dynamic systems.
sys1 = rss(3);
sys2 = rss(3);
sp = stepplot(sys1,sys2);
Each step response settles at a different steady-state value. Use the plot handle to normalize the plotted response.
sp.Normalize = "on";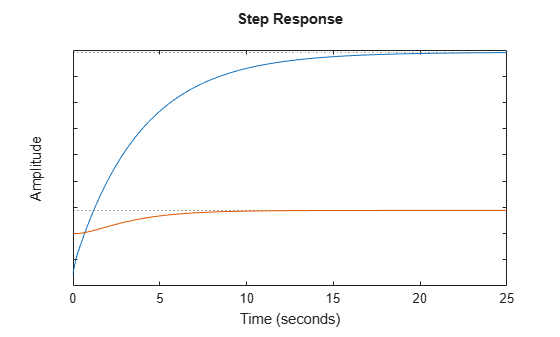
Now, the responses settle at the same value expressed in arbitrary units.
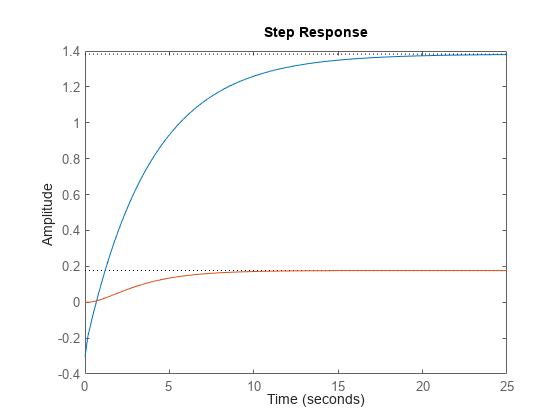
Compare the step response of a parametric identified model to a nonparametric (empirical) model, and view their 3-σ confidence regions. (Identified models require System Identification Toolbox™ software.)
Identify a parametric and a nonparametric model from sample data.
load iddata1 z1
sys1 = ssest(z1,4);
sys2 = impulseest(z1);
Plot the step responses of both identified models. Use the plot handle to display the 3-σ confidence regions.
t = -1:0.1:5;
sp = stepplot(sys1,'r',sys2,'b',t);
showConfidence(sp,3)
legend('parametric','nonparametric')
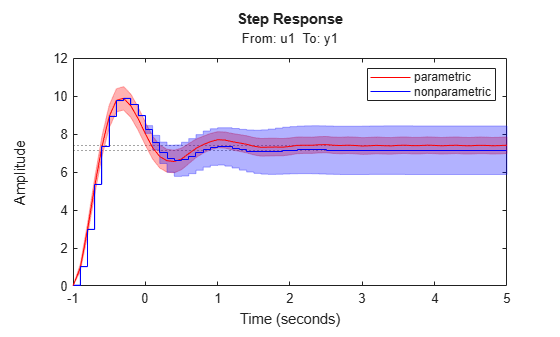
The nonparametric model sys2 shows higher uncertainty.
For this example, examine the step response of the following zero-pole-gain model and limit the step plot to tFinal = 15 s. Use 15-point blue text for the title. This plot should look the same, regardless of the preferences of the MATLAB session in which it is generated.
sys = zpk(-1,[-0.2+3j,-0.2-3j],1)*tf([1 1],[1 0.05]);
tFinal = 15;
First, create a default options set using timeoptions.
plotoptions = timeoptions;
Next change the required properties of the options set plotoptions.
plotoptions.Title.FontSize = 15;
plotoptions.Title.Color = [0 0 1];
Now, create the step response plot using the options set plotoptions.
h = stepplot(sys,tFinal,plotoptions);
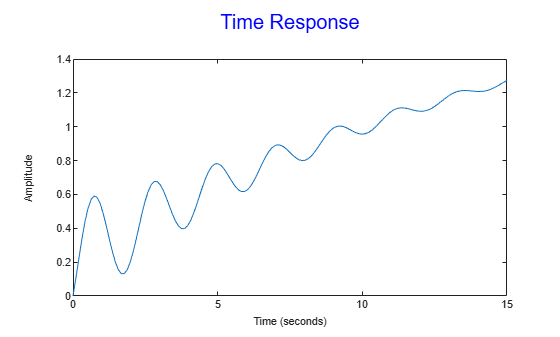
Because plotoptions begins with a fixed set of options, the plot result is independent of the toolbox preferences of the MATLAB session.
Load data for estimating a nonlinear Hammerstein-Wiener model.
load twotankdata
z = iddata(y,u,0.2,'Name','Two tank system');
z is an iddata object that stores the input-output estimation data.
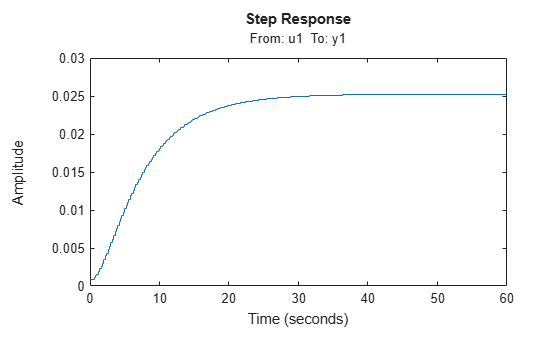
Estimate a Hammerstein-Wiener Model of order [1 5 3] using the estimation data. Specify the input nonlinearity as piecewise linear and output nonlinearity as one-dimensional polynomial.
sys = nlhw(z,[1 5 3],idPiecewiseLinear,idPolynomial1D);
Create an option set to specify input offset and step amplitude level.
opt = RespConfig(InputOffset=2,Amplitude=0.5);
Plot the step response until 60 seconds using the specified options.
stepplot(sys,60,opt);
Since R2025a
Create a state-space model with complex coefficients.
A = [-2-2i -2;1 0];
B = [2;0];
C = [0 0.5+2.5i];
D = 0;
sys = ss(A,B,C,D);
Plot the step response of the system.
sp = stepplot(sys);
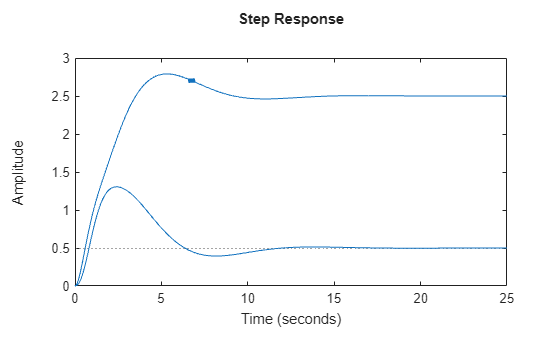
By default, the plot shows the real and imaginary components of the response on a single axes, indicating the imaginary component using a diamond marker.
You can also view the complex response using either a magnitude-phase plot or a complex-plane plot. For example, to view the magnitude and phase of the response, right-click the plot area and select Complex View >Magnitude-Phase.
Alternatively, you can set the ComplexViewType parameter of the corresponding chart object.
sp.ComplexViewType = "magnitudephase";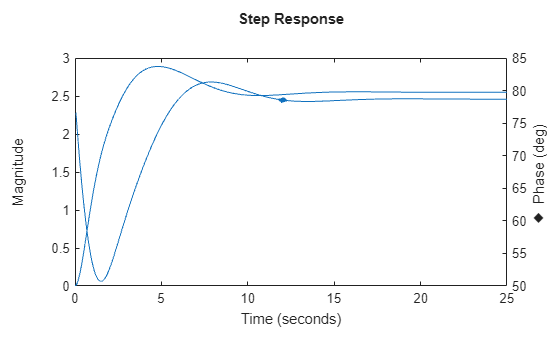
The plot shows the magnitude and phase of the response on a single axes, indicating the phase plot using a diamond marker.
You can view response characteristics in the plot. For example, to view the peak response, right-click the plot and select Characteristics > Peak Response.
Alternatively, you can enable the Visible property of the corresponding characteristic parameter of the chart object.
sp.Characteristics.PeakResponse.Visible = "on";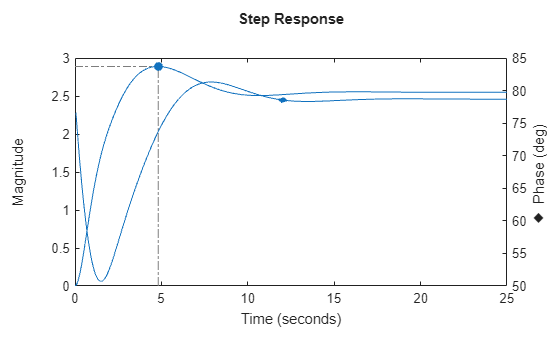
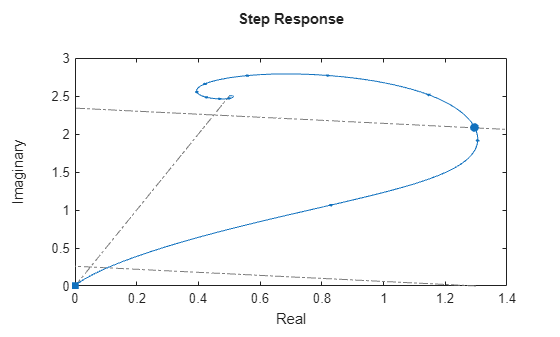
For complex responses, rise time is computed based on the projection of the response onto the ray that connects the initial output value to the final output value. To view this projection, show the response on the complex plane and enable the rise-time characteristic. For clarity, remove the peak response display.
sp.ComplexViewType = "complexplane";
sp.Characteristics.RiseTime.Visible = "on";
sp.Characteristics.PeakResponse.Visible = "off";
Tips
Plots created using
stepplotdo not support multiline titles or labels specified as string arrays or cell arrays of character vectors. To specify multiline titles and labels, use a single string with anewlinecharacter.stepplot(sys) title("first line" + newline + "second line");