bodemag
Magnitude-only Bode plot of frequency response
Syntax
Description
bodemag enables you to generate magnitude-only plots to
visualize the magnitude frequency response of a dynamic system.
For more comprehensive and customizable plotting function, see bodeplot.
To obtain magnitude and phase data, see bode.
bodemag( creates a Bode
magnitude plot of the frequency response of the dynamic
system model
sys)sys. The plot displays the magnitude (in dB) of the system
response as a function of frequency. bodemag automatically
determines frequencies to plot based on system dynamics.
If sys is a multi-input, multi-output (MIMO) model, then
bodemag produces an array of Bode magnitude plots in
which each plot shows the frequency response of one I/O pair.
If sys is a model with complex coefficients, then
in:
Log frequency scale, the plot shows two branches, one for positive frequencies and one for negative frequencies. The plot also shows arrows to indicate the direction of increasing frequency values for each branch. See Bode Plot of Model with Complex Coefficients.
Linear frequency scale, the plot shows a single branch with a symmetric frequency range centered at a frequency value of zero.
bodemag(___,
specifies response properties using one or more name-value arguments. For
example, Name=Value)bodemag(sys,LineWidth=1) sets the plot line width to
1.
When plotting responses for multiple systems, the specified name-value arguments apply to all responses.
The following name-value arguments override values specified in other input arguments.
bp = bodemag(___)
Examples
Create a Bode magnitude plot of the following continuous-time SISO dynamic system.
H = tf([1 0.1 7.5],[1 0.12 9 0 0]);
bodemag(H)
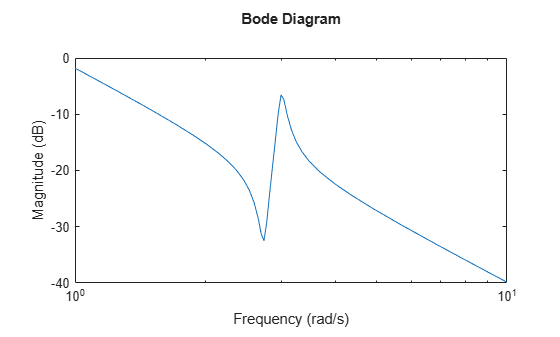
bodemag automatically selects the plot range based on the system dynamics.
Create a Bode magnitude plot over a specified frequency range. Use this approach when you want to focus on the dynamics in a particular range of frequencies.
H = tf([-0.1,-2.4,-181,-1950],[1,3.3,990,2600]);
bodemag(H,{1,100})
grid on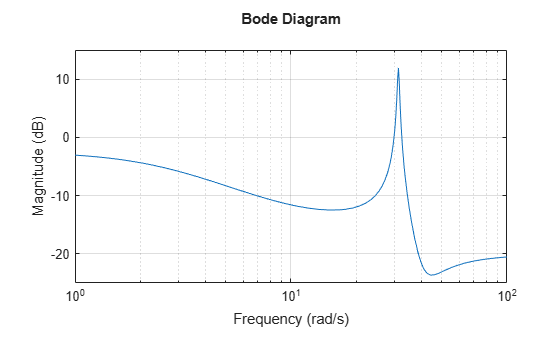
The cell array {1,100} specifies the minimum and maximum frequency values in the Bode magnitude plot. When you provide frequency bounds in this way, the function selects intermediate points for frequency response data.
Alternatively, specify a vector of frequency points to use for evaluating and plotting the frequency response.
w = [1 5 10 15 20 23 31 40 44 50 85 100];
bodemag(H,w,'.-')
grid on
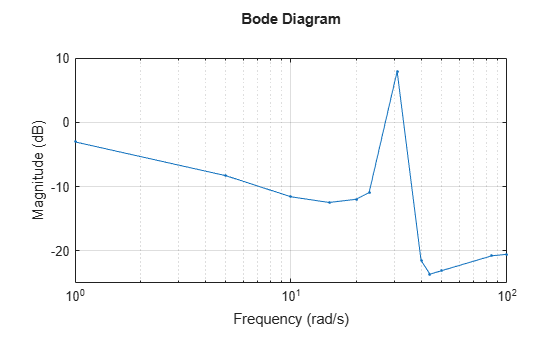
bodemag plots the frequency response at the specified frequencies only.
Compare the magnitude of the frequency response of a continuous-time system to an equivalent discretized system on the same Bode plot.
Create continuous-time and discrete-time dynamic systems.
H = tf([1 0.1 7.5],[1 0.12 9 0 0]);
Hd = c2d(H,0.5,'zoh');
Create a Bode magnitude plot that displays the responses of both systems.
bodemag(H,Hd)
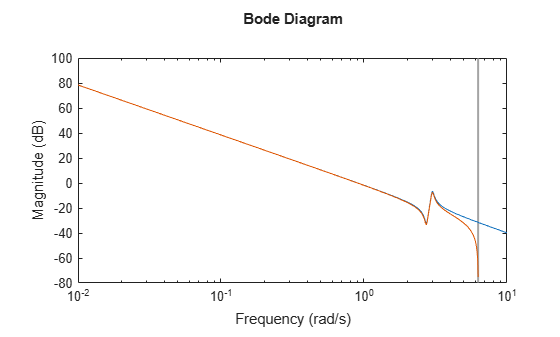
The Bode magnitude plot of a discrete-time system includes a vertical line marking the Nyquist frequency of the system.
Specify the color, linestyle, or marker for each system in a Bode magnitude plot using the LineSpec input arguments.
H = tf([1 0.1 7.5],[1 0.12 9 0 0]);
Hd = c2d(H,0.5,'zoh');
bodemag(H,'r',Hd,'b--')
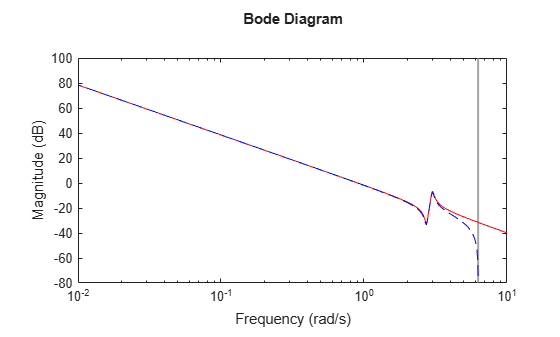
The first LineSpec argument 'r' specifies a solid red line for the response of H. The second LineSpec argument 'b--' specifies a dashed blue line for the response of Hd.
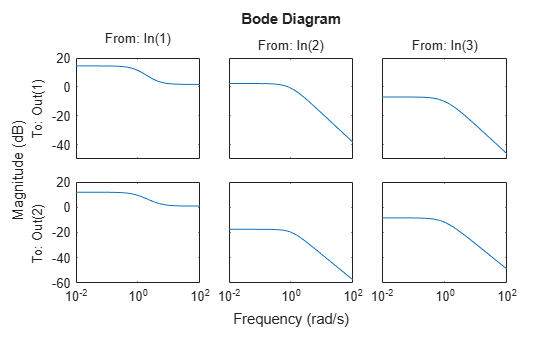
For this example, create a 2-output, 3-input system.
rng(0,'twister'); % For reproducibility
H = rss(4,2,3);
For this system, bodemag plots the magnitude-only frequency responses of each I/O channel in a separate plot in a single figure.
bodemag(H)
Input Arguments
Name-Value Arguments
Output Arguments
Algorithms
The software computes the frequency response as follows:
Compute the zero-pole-gain (
zpk) representation of the dynamic system.Evaluate the gain and phase of the frequency response based on the zero, pole, and gain data for each input/output channel of the system.
For continuous-time systems, the
bodemagfunction evaluates the frequency response on the imaginary axis s = jω and considers only positive frequencies.For discrete-time systems, the
bodemagfunction evaluates the frequency response on the unit circle. To facilitate interpretation, the command parameterizes the upper half of the unit circle as:where Ts is the sample time and ωN is the Nyquist frequency. The software then uses the equivalent continuous-time frequency ω as the x-axis variable. Because is periodic with period 2ωN, the
bodemagfunction plots the response only up to the Nyquist frequency ωN. Ifsysis a discrete-time model with an unspecified sample time, thebodemagfunction uses Ts = 1.
Alternative Functionality
You can also create a magnitude-only frequency response using bodeplot. To do so, set the PhaseVisible property
of the bodeplot chart object to "off".
bp = bodeplot(sys);
bp.PhaseVisible = "off";