shortPeriodCategoryCPlot
Syntax
Description
Basic Syntax and Line Specification
shortPeriodCategoryCPlot(
plots vector nalpha,omega)omega versus vector nalpha. If
nalpha or omega is a matrix, then the function
plots the vector versus the rows or columns of the matrix, whichever are aligned. If
nalpha is a scalar and omega is a vector, the
function creates the disconnected line objects and plots them as discrete points
vertically at nalpha. This function is based on the MATLAB®
plot function.
shortPeriodCategoryCPlot(
plots short-period category A requirements specified by the line specification
nalpha,omega,LineSpec)LineSpec.
shortPeriodCategoryCPlot(
combines the plots specified by the nalpha1,omega1,LineSpec1,...nalphan,omegan,LineSpecn)nalpha,
omega, and linespec. It sets the line style,
marker type, and color for each line. You can mix nalpha,
omega, LineSpec triplets with
nalpha, omega arguments, for example,
plot(nalpha1,omega1,nalpha2,omega2,LineSpec2,nalpha3,omega3).
Name-Value Arguments and Axes Specification
shortPeriodCategoryCPlot(___,
plots an altitude envelope contour specified by one or more
Name,Value)Name,Value arguments. Specify name-value arguments after all other
input arguments.
shortPeriodCategoryCPlot( draws an
altitude contour plot onto the axes ax,___)ax. Specify arguments as
previously listed after the ax argument.
Return Line Objects
Examples
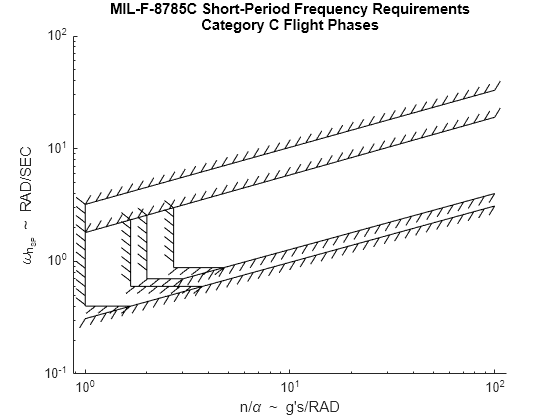
Plot the reference MIL-F-8785C short-period category C requirements.
shortPeriodCategoryCPlot([])
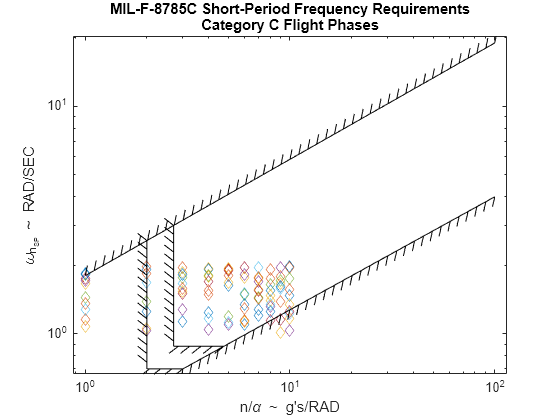
Plot nalpha and omega data against the level 1 short-period category C requirements using diamond markers.
nalpha = 1:10;
omega = rand(10)+1;
shortPeriodCategoryCPlot(nalpha,omega,"d","Level","1")
Plot the reference MIL-F-8785C short-period category C requirements. Return line objects and boundary line objects in h and b.
[h,b] = shortPeriodCategoryCPlot([])

h =
  0×1 empty Line array.
b =
  8×1 BoundaryLine array:

  BoundaryLine    (Level 1)
  BoundaryLine    (Level 1)
  BoundaryLine    (Level 1 - Classes II-L, III)
  BoundaryLine    (Level 1 - Classes I, II-C, IV)
  BoundaryLine    (Level 2 - Classes II-L, III)
  BoundaryLine    (Level 2 - Classes I, II-C, IV)
  BoundaryLine    (Level 2)
  BoundaryLine    (Level 2 & 3)
Input Arguments
Load factor per angle of attack n/α, specified as a scalar, vector, or matrix, in g's/radian.
Data Types: double
Short-period undamped natural frequency response ωnSP, specified as a scalar, vector, or matrix, in radians/second.
Data Types: double
Valid axes, specified as a scalar handle. By default, this function plots to the current axes,
obtainable with the gca function.
Data Types: double
Line style, marker, and color, specified as a string scalar or character vector containing symbols. The symbols can appear in any order. You do not need to specify all three characteristics (line style, marker, and color). For example, if you omit the line style and specify the marker, then the plot shows only the marker and no line.
Example: "--or" is a red dashed line with circle markers.
| Line Style | Description | Resulting Line |
|---|---|---|
"-" | Solid line |
|
"--" | Dashed line |
|
":" | Dotted line |
|
"-." | Dash-dotted line |
|
| Marker | Description | Resulting Marker |
|---|---|---|
"o" | Circle |
|
"+" | Plus sign |
|
"*" | Asterisk |
|
"." | Point |
|
"x" | Cross |
|
"_" | Horizontal line |
|
"|" | Vertical line |
|
"square" | Square |
|
"diamond" | Diamond |
|
"^" | Upward-pointing triangle |
|
"v" | Downward-pointing triangle |
|
">" | Right-pointing triangle |
|
"<" | Left-pointing triangle |
|
"pentagram" | Pentagram |
|
"hexagram" | Hexagram |
|
| Color Name | Short Name | RGB Triplet | Appearance |
|---|---|---|---|
"red" | "r" | [1 0 0] |
|
"green" | "g" | [0 1 0] |
|
"blue" | "b" | [0 0 1] |
|
"cyan"
| "c" | [0 1 1] |
|
"magenta" | "m" | [1 0 1] |
|
"yellow" | "y" | [1 1 0] |
|
"black" | "k" | [0 0 0] |
|
"white" | "w" | [1 1 1] |
|
Name-Value Arguments
Output Arguments
Version History
Introduced in R2021b
See Also
altitudeEnvelopeContour | shortPeriodCategoryAPlot | shortPeriodCategoryBPlot | boundaryline | line | Line | plot