37 results
Turns the mouse into a pop-up magnifying glass to look at details of 2D plots.
Ever wish MATLAB had a magnifying glass so you could look at the details of a small region of your plots without having to zoom in and out again and again? Just run 'magnify.m' with the figure of
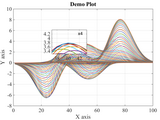
Powerful on-figure magnifier, suitable for the publication of compact graphical results
suit the requirements of any publication's editor. More details on interfacing and properties can be found in the .m file.EXAMPLE: (for usage examples, run 'magnify
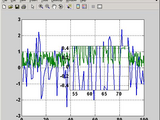
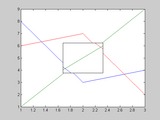
This function magnifies a specified rectangular area in the current figure, and plots the magnified area on the same figure.
This function magnifies a specified rectangular area [xlm, ylm]in the current figure,and plots the magnified area on the same figure at axis defined by position posInputs: xlm = 1x2 vector

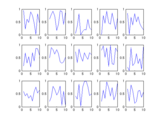
A real-time mouse-following magnifying glass of several different shapes
This program demonstrates how to implement a not-so-simple real time magnifying glass. How to use:-----------just type:magnifierormagnifier(mask, FPS) wheremask is the shape of the magnifying

Pixel magnification of a region of the screen.

An ImageJ like, Multi-functional, GUI-based Program for Image (Matrix) Processing and Analysis

Easily create magnifier axis with cliking,dragging and scrolling
h: Figure handle,default: gcf1 Draw a rectangle by dragging open a box to create a magnifier axis2 Click and dragging move the axis3 Scroll to magnify the graph in magnifier axis4 Press ESC to freeze
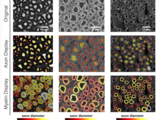
AxonSeg is a GUI that performs axon and myelin segmentation on histology images.


Fractal Image Compression and Decompression able of projecting the decoded image into bigger size.
Version 1.1.0.0
KeyvanThis Matlab code can compress true color or gray-scale images using Fractal Image Compression

Magnify contents of dragged rectangle to other figure.
A Jeweler's Loupe tool that provides a magnified view of a plot.
JEWELERSLOUPE modifies a figure to enable a Jeweler's Loupe tool. JEWELERSLOUPE(FIG) will modify the figure with handle FIG to allow a jeweler's loupe tool, which magnifies the axes by a factor

A Numerical Simulation Platform for Magnetic Resonance Imaging (MRI)

the best tool for signal processing, of a section of your data.

This is a GUI program written that can be used to visualize &analyze parts of a speech wav/music file.
Interactive zooming on a 2D plot using a magnifier.

Add a zoom-in pan on a figure
This function get:1. A handle of Axes to magnify2. An area to magnify by a 4-element vector that defines the lower-left and upper-right corners of a rectangle3. The position of the magnifying pan in

PENDANTSS performs denoising, detrending and deconvolution for sparse peak-like signals (e.g. from analytical chemistry: chromatography)
uitoolbarScrollResize adds a uitoolbar for magnifying,the contents (Children) of a figure fig.
uitoolbarScrollResize adds a uitoolbar with uipushtool buttons for magnifying, reducing, scrolling the contents (Children) of a figure fig.When you create a figure with a lot of axes (subplots) in a

Simplified management of figure pointer property
back 'closedhand' - closed hand 'glass' - magnifying glass 'lrdrag' - left/right drag cursor 'ldrag' - left drag cursor 'rdrag' - right drag cursor 'uddrag' - up/down drag cursor

DRAGZOOM allows you to handy interactively manage the axes in figure.

Plots 3D data on a sphere.
profile Zin with the data scaling factor, Zscale. This allows you to scale the peaks and troughs of the data on the surface if the radius is relatively large. Zscale larger than 1 magnifies the data range

An interactive magnification tool for MATLAB figures that displays a real-time zoomed view of your signals as you move your cursor. Perfect
✨ **Real-time Zoom Window** - Separate window shows magnified view of the region under your cursor🎯 **Multiple Zoom Modes**- **Box Mode**: Zoom both X and Y axes (magnifying glass effect)- **X-Only Mode**: Zoom


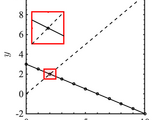
Interactively draw the zoom area and axes for zoomed axes inlays. Check out the examples in the function to get started.
% Interactive Zoom plot% [p_ax,ch_ax]= ZoomPlot()% [p_ax,ch_ax]= ZoomPlot(p_ax)%% This function allow you draw zoomed/magnified axes on a existing axes.% The funciton gets its axes handle from gca

inse2DAbsolute creates an axes inset, defined using the larger axes, and corresponding annotations
With one click, zoom axes for better visibility.


CYL3D plots 3D data on a cylinder.
data scaling factor, Zscale. This allows you to scale the peaks and troughs of the data on the surface if the radius isrelatively large. Zscale larger than 1 magnifies the data range correspondingly
Zoom in and out using the wheel in a rather practical manner
*) Magnify: General magnitication factor. Unity or greater (by default 1.1). *) XMagnify: Magnification factor of X axis (unity by default). *) YMagnify: Magnification factor of Y axis (unity by

Shortcuts and menus to graphical utilities (scale, zoom, translation and initialization)

A generator feed by a constant speed of 1800rpm but electrical power isn't constant why?
, Pe is still fluctuating as seen in the magnified picture on the right. Is there any type of filters or modifications I should do to correct the model? Any comments on the model is greatly appreciated

Teach numerical methods for interpolation, differentiation, integration, and solving ODEs and PDEs with MATLAB.
approximation to a derivative - demonstrate how numerical derivatives can magnify approximation errors | **Applications** - Numerical solutions to differential equations || :-- | :-- | :-- |##

Harmonic Equalizer plugin
familiar it, click the magnifying glass in the upper left corner, type terminal, and hit Enter to launch it.Type sudo xattr -rd com.apple.quarantine /Library/Audio/Plug-Ins/, replacing with the name of the
Drag and Drop Line Objects From wthin any axes in any figure.

The most advanced toolbox for neuroscience stimulus presentation, response collection and data collection.
You can also select a web site from the following list
Americas
- América Latina (Español)
- Canada (English)
- United States (English)
Europe
- Belgium (English)
- Denmark (English)
- Deutschland (Deutsch)
- España (Español)
- Finland (English)
- France (Français)
- Ireland (English)
- Italia (Italiano)
- Luxembourg (English)
- Netherlands (English)
- Norway (English)
- Österreich (Deutsch)
- Portugal (English)
- Sweden (English)
- Switzerland
- United Kingdom (English)
Asia Pacific
- Australia (English)
- India (English)
- New Zealand (English)
- 中国
- 日本Japanese (日本語)
- 한국Korean (한국어)