How to make a 3D plot of 41x41x41 datapoints
Show older comments
I have done some simulations creating 41x41x41 datapoint and I would like to plot this in 3D. The points are either 1 (good) or 0 (bad) (or 1 and NaN or anything like this) and I want to show the area of good points in a 3D plot but I have no idea to do this.
The figure can be a pointcloud or just a solid in the middle of the figure (all the good points should be close to each other)
EDIT: I've added a dummy file with some data (5x5x5) which I try to plot in 3D (ABC_test). I'll add some real data file when I have the data available.
Answers (2)
You can have a look here to see different solutions to plot data in 3D:
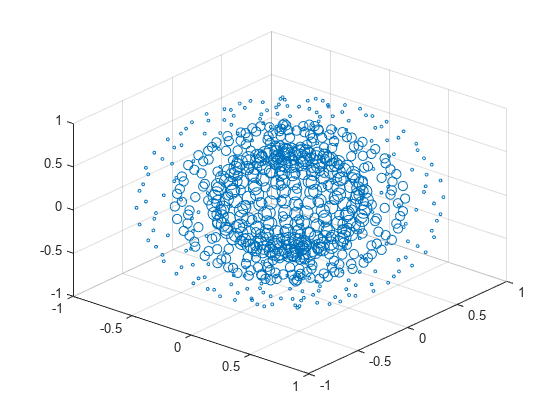
You can also consider using the plot3 function:
1 Comment
Categories
Find more on Scatter Plots in Help Center and File Exchange
Community Treasure Hunt
Find the treasures in MATLAB Central and discover how the community can help you!
Start Hunting!