Main Content

detect

Detect objects using YOLO v4 object detector

Since R2022a

Description

bboxes = detect(detector,I) detects objects within a single image or an array of images, I, using a you only look once version 4 (YOLO v4) object detector, detector. The detect function automatically resizes and rescales the input image to match that of the images used for training the detector. The locations of objects detected in the input image are returned as a set of bounding boxes.

Note

To use the pretrained YOLO v4 object detection networks trained on COCO dataset, you must install the Computer Vision Toolbox™ Model for YOLO v4 Object Detection. You can download and install the Computer Vision Toolbox Model for YOLO v4 Object Detection from Add-On Explorer. For more information about installing add-ons, see Get and Manage Add-Ons. To run this function, you will require the Deep Learning Toolbox™.

example

[bboxes,scores] = detect(detector,I) also returns the class-specific confidence scores for each bounding box.

example

[bboxes,scores,labels] = detect(detector,I) returns a categorical array of labels assigned to the bounding boxes. The labels for object classes are defined during training.

example

[bboxes,scores,labels,info] = detect(detector,I) also returns information about the class probabilities and objectness scores for each detection.

detectionResults = detect(detector,ds) detects objects within all the images returned by the read function of the input datastore ds.

example

[___] = detect(___,roi) detects objects within the rectangular search region roi, in addition to any combination of arguments from previous syntaxes.

example

[___] = detect(___,Name=Value) specifies options using one or more name-value arguments, in addition to any combination of arguments from previous syntaxes..

Examples

collapse all

Specify the name of a pretrained YOLO v4 deep learning network.

name = 'tiny-yolov4-coco';

Create YOLO v4 object detector by using the pretrained YOLO v4 network.

detector = yolov4ObjectDetector(name);

Detect objects in an unknown image by using the pretrained YOLO v4 object detector.

img = imread('sherlock.jpg');
img = im2single(imresize(img,0.5));
[bboxes,scores,labels] = detect(detector,img,Threshold=0.4)
bboxes = 1×4 single row vector

   80.9433   31.6083  398.4628  288.3917

scores = single
    0.4281
labels = categorical
     dog 

Display the detection results.

detectedImg = insertObjectAnnotation(img,'Rectangle',bboxes,labels);
figure
imshow(detectedImg)

Load a pretrained YOLO v4 object detector.

detector = yolov4ObjectDetector("csp-darknet53-coco");

Read the test data and store as an image datastore object.

location = fullfile(matlabroot,'toolbox','vision','visiondata','vehicles');
imds = imageDatastore(location);

Detect objects in the test dataset. Set the Threshold parameter value to 0.4 and MiniBatchSize parameter value to 32.

detectionResults = detect(detector,imds,Threshold=0.4,MiniBatchSize=32);

Read an image from the test dataset and extract the corresponding detection results.

num = 20;
I = readimage(imds,num);
bboxes = detectionResults.Boxes{num};
labels = detectionResults.Labels{num};
scores = detectionResults.Scores{num};

Perform non-maximal suppression to select strongest bounding boxes from the overlapping clusters. Set the OverlapThreshold parameter value to 0.5.

[bboxes,scores,labels] = selectStrongestBboxMulticlass(bboxes,...
                              scores,labels,OverlapThreshold=0.5);

Display the detection results.

results = table(bboxes,labels,scores)
results=2×3 table
                   bboxes                   labels    scores 
    ____________________________________    ______    _______

    17.818    69.966    23.459    11.381     car      0.90267
    75.206    66.011    26.134    23.541     car      0.58296

detectedImg = insertObjectAnnotation(I,"Rectangle",bboxes,labels);
figure
imshow(detectedImg)

Load a pretrained YOLO v4 object detector.

detector = yolov4ObjectDetector("csp-darknet53-coco");

Read a test image.

img = imread("stopsign.jpg");

Specify a region of interest (ROI) within the test image.

roiBox = [250 60 500 300];

Detect objects within the specified ROI.

[bboxes,scores,labels] = detect(detector,img,roiBox);

Display the ROI and the detection results.

img = insertObjectAnnotation(img,"Rectangle",roiBox,"ROI",AnnotationColor="blue");
detectedImg = insertObjectAnnotation(img,"Rectangle",bboxes,labels);
figure
imshow(detectedImg)

Input Arguments

collapse all

YOLO v4 object detector, specified as a yolov4ObjectDetector object.

Test images, specified as a numeric array of size H-by-W-byC or H-by-W-byC-by-T. Images must be real, nonsparse, grayscale or RGB image.

  • H: Height

  • W: Width

  • C: The channel size in each image must be equal to the network's input channel size. For example, for grayscale images, C must be equal to 1. For RGB color images, it must be equal to 3.

  • T: Number of test images in the array. The function computes the object detection results for each test image in the array.

Data Types: uint8 | uint16 | int16 | double | single

Test images, specified as a ImageDatastore object, CombinedDatastore object, or TransformedDatastore object containing full filenames of the test images. The images in the datastore must be grayscale, or RGB images.

Search region of interest, specified as an [x y width height] vector. The vector specifies the upper left corner and size of a region in pixels.

Name-Value Arguments

Specify optional pairs of arguments as Name1=Value1,...,NameN=ValueN, where Name is the argument name and Value is the corresponding value. Name-value arguments must appear after other arguments, but the order of the pairs does not matter.

Example: detect(detector,I,Threshold=0.25)

Detection threshold, specified as a scalar in the range [0, 1]. Detections that have scores less than this threshold value are removed. To reduce false positives, increase this value.

Select the strongest bounding box for each detected object, specified as true or false.

  • true — Returns the strongest bounding box per object. The method calls the selectStrongestBboxMulticlass function, which uses nonmaximal suppression to eliminate overlapping bounding boxes based on their confidence scores.

    By default, the selectStrongestBboxMulticlass function is called as follows

     selectStrongestBboxMulticlass(bboxes,scores,...
                                   RatioType="Union",...
                                   OverlapThreshold=0.5);

  • false — Return all the detected bounding boxes. You can then write your own custom method to eliminate overlapping bounding boxes.

Minimum region size, specified as a vector of the form [height width]. Units are in pixels. The minimum region size defines the size of the smallest region containing the object.

By default, MinSize is 1-by-1.

Maximum region size, specified as a vector of the form [height width]. Units are in pixels. The maximum region size defines the size of the largest region containing the object.

By default, MaxSize is set to the height and width of the input image, I. To reduce computation time, set this value to the known maximum region size for the objects that can be detected in the input test image.

Minimum batch size, specified as a scalar value. Use the MiniBatchSize to process a large collection of image. Images are grouped into minibatches and processed as a batch to improve computation efficiency. Increase the minibatch size to decrease processing time. Decrease the size to use less memory.

Hardware resource on which to run the detector, specified as "auto", "gpu", or "cpu".

  • "auto" — Use a GPU if it is available. Otherwise, use the CPU.

  • "gpu" — Use the GPU. To use a GPU, you must have Parallel Computing Toolbox™ and a CUDA®-enabled NVIDIA® GPU. If a suitable GPU is not available, the function returns an error. For information about the supported compute capabilities, see GPU Computing Requirements (Parallel Computing Toolbox).

  • "cpu" — Use the CPU.

Performance optimization, specified one of the following:

  • "auto" — Automatically apply a number of optimizations suitable for the input network and hardware resource.

  • "mex" — Compile and execute a MEX function. This option is available when using a GPU only. Using a GPU requires Parallel Computing Toolbox and a CUDA enabled NVIDIA GPU. If Parallel Computing Toolbox or a suitable GPU is not available, then the function returns an error. For information about the supported compute capabilities, see GPU Computing Requirements (Parallel Computing Toolbox).

  • "none" — Disable all acceleration.

The default option is "auto". If "auto" is specified, MATLAB® applies a number of compatible optimizations. If you use the "auto" option, MATLAB does not ever generate a MEX function.

Using the Acceleration options "auto" and "mex" can offer performance benefits, but at the expense of an increased initial run time. Subsequent calls with compatible parameters are faster. Use performance optimization when you plan to call the function multiple times using new input data.

The "mex" option generates and executes a MEX function based on the network and parameters used in the function call. You can have several MEX functions associated with a single network at one time. Clearing the network variable also clears any MEX functions associated with that network.

The "mex" option is only available for input data specified as a numeric array, cell array of numeric arrays, table, or image datastore. No other types of datastore support the "mex" option.

The "mex" option is only available when you are using a GPU. You must also have a C/C++ compiler installed. For setup instructions, see MEX Setup (GPU Coder).

"mex" acceleration does not support all layers. For a list of supported layers, see Supported Layers (GPU Coder).

Output Arguments

collapse all

Location of objects detected within the input image or images, returned as a

  • M-by-4 matrix or an M-by-5 matrix if the input is a single test image.

  • T-by-1 cell array if the input is an array of test images. T is the number of test images in the array. M is the number of bounding boxes in an image

The table describes the format of bounding boxes.

Bounding BoxDescription
rectangle

Defined in spatial coordinates as an M-by-4 numeric matrix with rows of the form [x y w h], where:

  • M is the number of axis-aligned rectangles.

  • x and y specify the upper-left corner of the rectangle.

  • w specifies the width of the rectangle, which is its length along the x-axis.

  • h specifies the height of the rectangle, which is its length along the y-axis.

rotated-rectangle

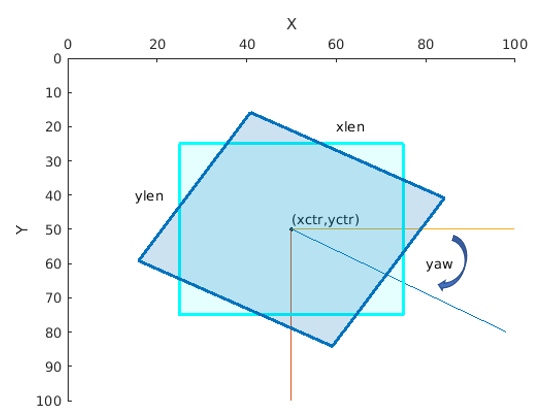
Defined in spatial coordinates as an M-by-5 numeric matrix with rows of the form [xctr yctr xlen ylen yaw], where:

  • M is the number of rotated rectangles.

  • xctr and yctr specify the center of the rectangle.

  • xlen specifies the width of the rectangle, which is its length along the x-axis before rotation.

  • ylen specifies the height of the rectangle, which is its length along the y-axis before rotation.

  • yaw specifies the rotation angle in degrees. The rotation is clockwise-positive around the center of the bounding box.

Square rectangle rotated by -30 degrees.

Detection confidence scores for each bounding box, returned as one of these options:

  • M-by-1 numeric vector — The input is a single test image. M is the number of bounding boxes detected in the image.

  • B-by-1 cell array — The input is a batch of test images, where B is the number of test images in the batch. Each cell in the array contains an M-element row vector, where each element indicates the detection score for a bounding box in the corresponding image.

A higher score indicates higher confidence in the detection. The confidence score for each detection is a product of the corresponding objectness score and maximum class probability. The objectness score is the probability that the object in the bounding box belongs to a class in the image. The maximum class probability is the largest probability that a detected object in the bounding box belongs to a particular class.

Labels for bounding boxes, returned as one of these options:

  • M-by-1 categorical vector if the input is a single test image.

  • T-by-1 cell array if the input is an array of test images. T is the number of test images in the array. Each cell in the array contains a M-by-1 categorical vector containing the names of the object classes.

M is the number of bounding boxes detected in an image.

Detection results, returned as a 3-column table with variable names, Boxes, Scores, and Labels. The Boxes column can contain rectangles or rotated rectangle bounding boxes of the form :

  • rectangle — M-by-4 matrices, of M bounding boxes for the objects found in the image. Each row specifies a rectangle as a 4-element vector of the form [x,y,width,height], where (x,y) specifies the upper-left corner location and (width, height) specifies the size in pixels

  • rotated rectangle — M-by-5 matrices of M bounding boxes for the objects found in the image. Each row specifies a rotated rectangle as a 5-element vector of the form [xctr,yctr,width, height,yaw], where (xctr,yctr) specifies the center, (width,height) specifies the size, and yaw specifies the rotated angle.

Class probabilities and objectness scores of the detections, returned as a structure array with these fields.

  • ClassProbabilities — Class probabilities for each of the detections, returned as a B-by-1 cell array. B is the number of images in the input batch of images, I. Each cell in the array contains the class probabilities as an M-by-N numeric matrix. M is the number of bounding boxes and N is the number of classes. Each class probability is a numeric scalar, indicating the probability that the detected object in the bounding box belongs to a class in the image.

  • ObjectnessScores — Objectness scores for each of the detections, returned as a B-by-1 cell array. B is the number of images in the input batch of images, I. Each cell in the array contains the objectness score for each bounding box as an M-by-1 numeric vector. M is the number of bounding boxes. Each objectness score is a numeric scalar, indicating the probability that the bounding box contains an object belonging to one of the classes in the image.

Extended Capabilities

Version History

Introduced in R2022a

expand all

Go to top of page