surfht
Interactive contour plot
Syntax
Description
Examples
This example shows how to use surfht to create an interactive contour plot.
Create a grid of the (x,y) domain from (–2,–2) to (2,2) using meshgrid.
[x,y] = meshgrid(-2:0.2:2,-2:0.2:2);
Evaluate the function over this domain.
z = x.*exp(-x.^2 - y.^2);
Open an interactive contour plot. Because meshgrid creates a grid of the x and y values, open the plot using the first row of x and the first column of y.
surfht(x(1,:),y(:,1),z)
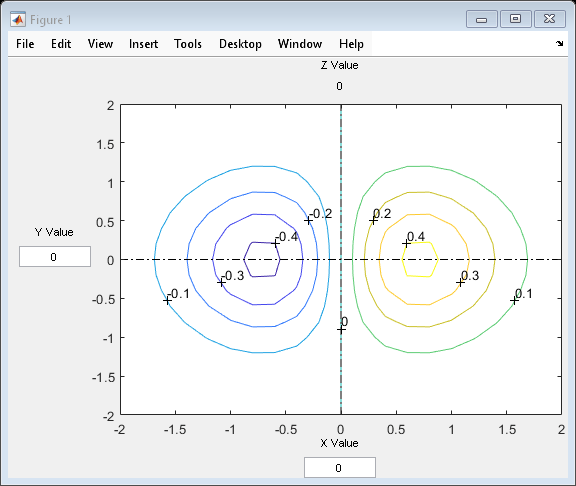
The figure shows a contour plot of the z values along the specified x- and y-axes.
Click the plot to evaluate z at the (x,y) coordinates indicated by the intersecting lines.
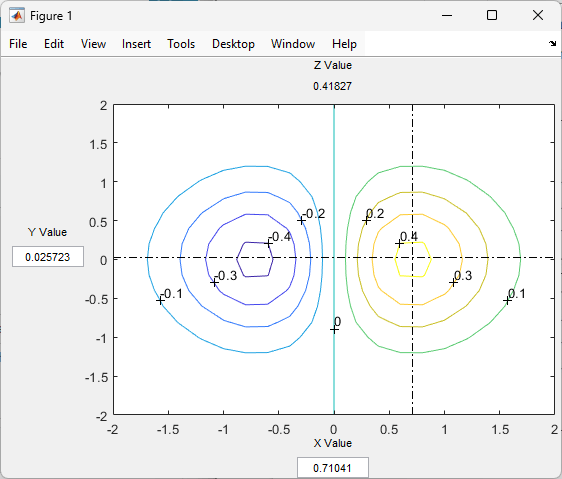
For example, at x = 0.71041 and y = 0.025723, the value of z is 0.41827.
Alternatively, enter values in the fields labeled X Value and Y Value to evaluate z at the specified coordinates. For example, evaluate z at x = 0.5 and y = 1.
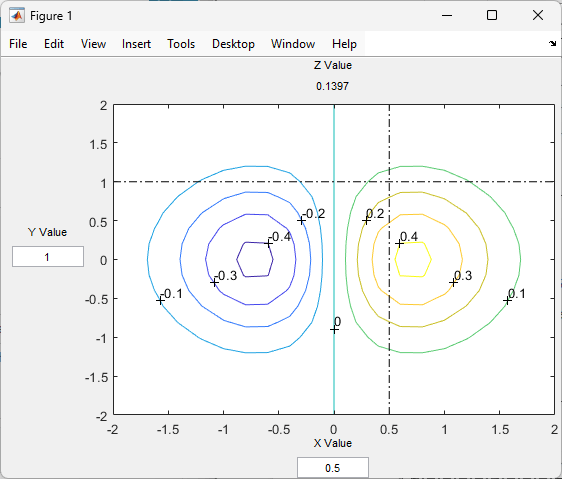
The value of z is 0.1397.