proflik
Profile likelihood function for probability distribution
Syntax
Description
Examples
Load the sample data. Create a probability distribution object by fitting a Weibull distribution to the miles per gallon (MPG) data.
load carsmall
pd = fitdist(MPG,'Weibull')
pd =
  WeibullDistribution

  Weibull distribution
    A = 26.5079   [24.8333, 28.2954]
    B = 3.27193   [2.79441, 3.83104]
View the parameter names for the distribution.
pd.ParameterNames
ans = 1×2 cell
    {'A'}    {'B'}
For the Weibull distribution, A is in position 1, and B is in position 2.
Compute the profile likelihood for B, which is in position pnum = 2.
[ll,param] = proflik(pd,2);
Display the loglikelihood values for the estimated values of B.
[ll',param']
ans = 21×2

 -329.9688    2.7132
 -329.4312    2.7748
 -328.9645    2.8365
 -328.5661    2.8981
 -328.2340    2.9597
 -327.9658    3.0213
 -327.7596    3.0830
 -327.6135    3.1446
 -327.5256    3.2062
 -327.4943    3.2678
 -327.5178    3.3295
 -327.5946    3.3911
 -327.7233    3.4527
 -327.9023    3.5143
 -328.1303    3.5760
      ⋮
These results show that the profile log likelihood is maximized between the estimated B values of 3.2678 and 3.3295, which correspond to loglikelihood values -327.4943 and -327.5178. From the earlier fit, the MLE of B is 3.27193, which is in this interval as expected.
Load the sample data. Create a probability distribution object by fitting a generalized extreme value distribution to the miles per gallon (MPG) data.
load carsmall
pd = fitdist(MPG,'GeneralizedExtremeValue')
pd =
  GeneralizedExtremeValueDistribution

  Generalized Extreme Value distribution
        k = -0.207765   [-0.381674, -0.0338563]
    sigma =   7.49674   [6.31755, 8.89604]
       mu =   20.6233   [18.8859, 22.3606]
View the parameter names for the distribution.
pd.ParameterNames
ans = 1×3 cell
    {'k'}    {'sigma'}    {'mu'}
For the generalized extreme value distribution, k is in position 1, sigma is in position 2, and mu is in position 3.
Compute the profile likelihood for mu, which is in position pnum = 3. Restrict the computation to parameter values from 20 to 22, and display the plot.
[ll,param,other] = proflik(pd,3,20:.1:22,'display','on');
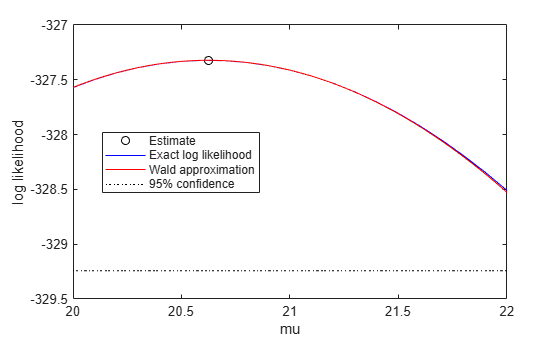
The plot shows the estimated value for the parameter mu that maximizes the loglikelihood.
Display the loglikelihood values for the estimated values of mu, and the values of the other distribution parameters that maximize the corresponding loglikelihood.
[ll',param',other]
ans = 21×4

 -327.5706   20.0000   -0.1803    7.4087
 -327.4971   20.1000   -0.1846    7.4218
 -327.4364   20.2000   -0.1890    7.4354
 -327.3887   20.3000   -0.1934    7.4493
 -327.3538   20.4000   -0.1978    7.4636
 -327.3317   20.5000   -0.2023    7.4783
 -327.3223   20.6000   -0.2067    7.4932
 -327.3257   20.7000   -0.2112    7.5084
 -327.3418   20.8000   -0.2156    7.5240
 -327.3706   20.9000   -0.2201    7.5399
 -327.4119   21.0000   -0.2245    7.5560
 -327.4659   21.1000   -0.2289    7.5723
 -327.5324   21.2000   -0.2333    7.5889
 -327.6113   21.3000   -0.2378    7.6057
 -327.7027   21.4000   -0.2422    7.6228
      ⋮
The first column contains the log likelihood value that corresponds to the estimate of mu in the second column. The log likelihood is maximized between the parameter values 20.6000 and 20.7000, corresponding to log likelihood values -327.3223 and -327.3257. The third column contains the value of k that maximizes the corresponding log likelihood for mu. The fourth column contains the value of sigma that maximizes the corresponding log likelihood for mu.
Input Arguments
Output Arguments
Extended Capabilities
Version History
Introduced in R2013a