lsline
Add least-squares line to scatter plot
Description
lsline superimposes a least-squares line on each scatter
plot in the current axes.
lsline ignores data points that are connected with solid,
dashed, or dash-dot lines ('-', '--', or
'.-') because it does not consider them to be scatter plots.
To produce scatter plots, use the MATLAB®
scatter and plot functions.
h = lsline(___)h using any of the
previous syntaxes. Use h to modify the properties of a specific
least-squares line after you create it. For a list of properties, see Line Properties.
Examples
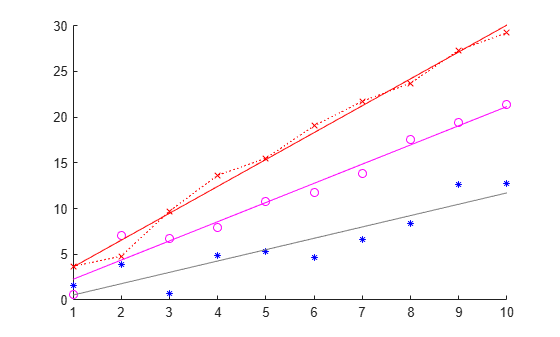
Generate three sets of sample data and plot each set on the same figure.
x = 1:10;
rng default;  % For reproducibility
figure;

y1 = x + randn(1,10);
scatter(x,y1,25,'b','*')
hold on

y2 = 2*x + randn(1,10);
plot(x,y2,'mo')

y3 = 3*x + randn(1,10);
plot(x,y3,'rx:')
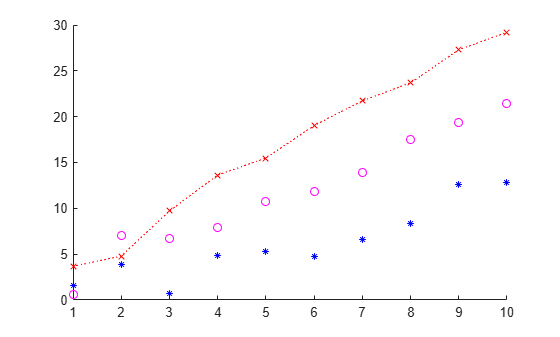
Add a least-squares line for each set of sample data.
lsline
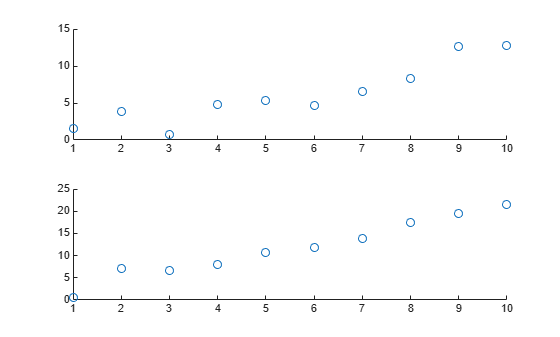
Define the x-variable and two different y-variables to use for the plots.
rng default  % For reproducibility
x = 1:10;
y1 = x + randn(1,10);
y2 = 2*x + randn(1,10);
Define ax1 as the top half of the figure, and ax2 as the bottom half of the figure. Create the first scatter plot on the top axis using y1, and the second scatter plot on the bottom axis using y2.
figure
ax1 = subplot(2,1,1);
ax2 = subplot(2,1,2);

scatter(ax1,x,y1)
scatter(ax2,x,y2)
Superimpose a least-squares line on the top plot, and a reference line at the mean of the y2 values in the bottom plot.
lsline(ax1) % This is equivalent to refline(ax1)

mu = mean(y2);
refline(ax2,[0 mu])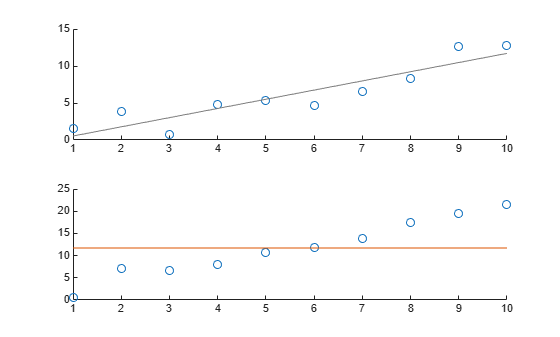
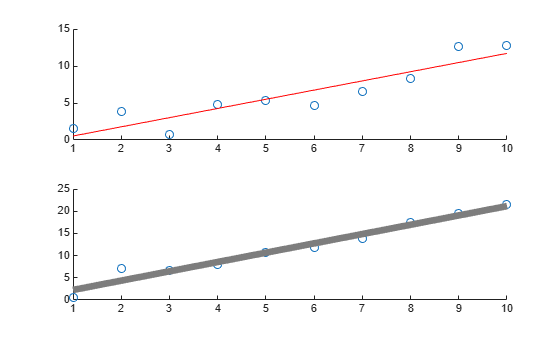
Define the x-variable and two different y-variables to use for the plots.
rng default  % For reproducibility
x = 1:10;
y1 = x + randn(1,10);
y2 = 2*x + randn(1,10);
Define ax1 as the top half of the figure, and ax2 as the bottom half of the figure. Create the first scatter plot on the top axis using y1, and the second scatter plot on the bottom axis using y2.
figure
ax1 = subplot(2,1,1);
ax2 = subplot(2,1,2);

scatter(ax1,x,y1)
scatter(ax2,x,y2)
Superimpose a least-squares line on the top plot. Then, use the least-squares line object h1 to change the line color to red.
h1 = lsline(ax1);
h1.Color = 'r';
Superimpose a least-squares line on the bottom plot. Then, use the least-squares line object h2 to increase the line width to 5.
h2 = lsline(ax2);
h2.LineWidth = 5;
Input Arguments
Output Arguments
Version History
Introduced before R2006a