Main Content

gline

Add line to plot interactively

    Description

    gline lets you select two points interactively in the current figure, and draws a line between the two points. When you click the first point, a line tracks the pointer movement until you click the second point to complete the line.

    gline(f) adds a line to the figure specified by f instead of the current figure.

    example

    g = gline(___) returns a Line object. Use g to modify the properties of the line after you create it. For a list of properties, see Line Properties.

    Examples

    collapse all

    Connect two points in a plot by using the gline function.

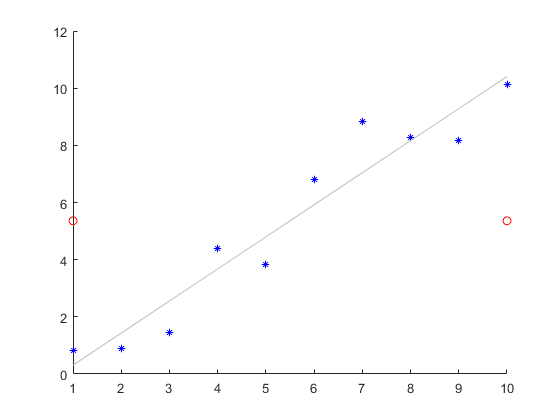
    Generate a sample data set, and create a scatter plot.

    x = 1:10;
    y = x + randn(1,10);
    scatter(x,y,25,"b","*")

    Superimpose a least-squares line on the scatter plot.

    lsline

    Plot red circle markers.

    mu = mean(y);
    hold on
    scatter([1 10],[mu mu],"ro")

    Axes object contains a scatter plot, least-squares line, and two markers

    Start the interactive line tool by calling the gline function for the current figure.

    g = gline;

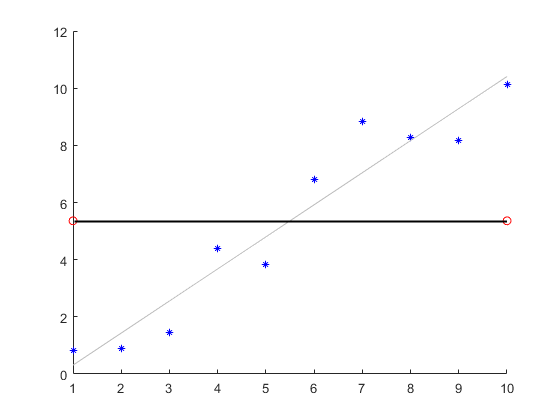
    Connect the two circle markers by selecting them. First, click one of the markers. A line appears and tracks the pointer movement. Then click the second marker to complete the line.

    Axes object contains a scatter plot, least-squares line, two markers, and a black line connecting the two markers

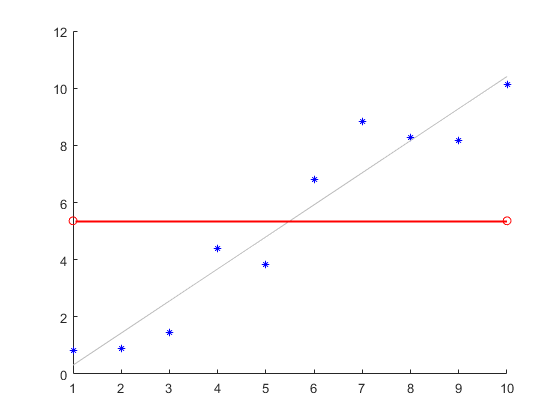
    Modify the line color by using g.

    set(g,"Color","r")

    Axes object contains a scatter plot, least-squares line, two markers, and a red line connecting the two markers

    Input Arguments

    collapse all

    Target figure, specified as a Figure object.

    Version History

    Introduced before R2006a
    See Also

    | |