Univariate feature ranking for classification using chi-square tests
ranks features (predictors) using chi-square tests.
The table idx
= fscchi2(Tbl
,ResponseVarName
)Tbl
contains predictor variables and a response variable,
and ResponseVarName
is the name of the response variable in
Tbl
. The function returns idx
, which contains
the indices of predictors ordered by predictor importance, meaning
idx(1)
is the index of the most important predictor. You can use
idx
to select important predictors for classification
problems.
specifies additional options using one or more name-value pair arguments in addition to
any of the input argument combinations in the previous syntaxes. For example, you can
specify prior probabilities and observation weights.idx
= fscchi2(___,Name,Value
)
Rank predictors in a numeric matrix and create a bar plot of predictor importance scores.
Load the sample data.
load ionosphere
ionosphere
contains predictor variables (X
) and a response variable (Y
).
Rank the predictors using chi-square tests.
[idx,scores] = fscchi2(X,Y);
The values in scores
are the negative logs of the p-values. If a p-value is smaller than eps(0)
, then the corresponding score value is Inf
. Before creating a bar plot, determine whether scores
includes Inf
values.
find(isinf(scores))
ans = 1x0 empty double row vector
scores
does not include Inf
values. If scores
includes Inf
values, you can replace Inf
by a large numeric number before creating a bar plot for visualization purposes. For details, see Rank Predictors in Table.
Create a bar plot of the predictor importance scores.
bar(scores(idx)) xlabel('Predictor rank') ylabel('Predictor importance score')
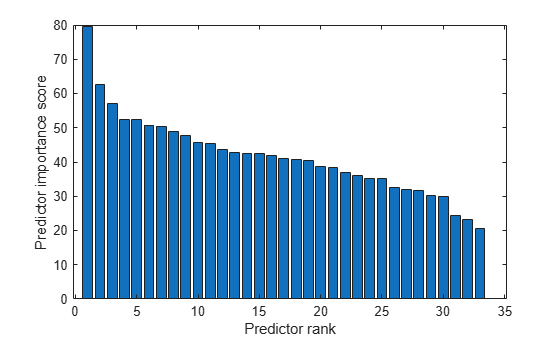
Select the top five most important predictors. Find the columns of these predictors in X
.
idx(1:5)
ans = 1×5
5 7 3 8 6
The fifth column of X
is the most important predictor of Y
.
Rank predictors in a table and create a bar plot of predictor importance scores.
If your data is in a table and fscchi2
ranks a subset of the variables in the table, then the function indexes the variables using only the subset. Therefore, a good practice is to move the predictors that you do not want to rank to the end of the table. Move the response variable and observation weight vector as well. Then, the indexes of the output arguments are consistent with the indexes of the table.
Load the census1994 data set.
load census1994
The table adultdata
in census1994
contains demographic data from the US Census Bureau to predict whether an individual makes over $50,000 per year. Display the first three rows of the table.
head(adultdata,3)
ans=3×15 table
age workClass fnlwgt education education_num marital_status occupation relationship race sex capital_gain capital_loss hours_per_week native_country salary
___ ________________ __________ _________ _____________ __________________ _________________ _____________ _____ ____ ____________ ____________ ______________ ______________ ______
39 State-gov 77516 Bachelors 13 Never-married Adm-clerical Not-in-family White Male 2174 0 40 United-States <=50K
50 Self-emp-not-inc 83311 Bachelors 13 Married-civ-spouse Exec-managerial Husband White Male 0 0 13 United-States <=50K
38 Private 2.1565e+05 HS-grad 9 Divorced Handlers-cleaners Not-in-family White Male 0 0 40 United-States <=50K
In the table adultdata
, the third column fnlwgt
is the weight of the samples, and the last column salary
is the response variable. Move fnlwgt
to the left of salary
by using the movevars
function.
adultdata = movevars(adultdata,'fnlwgt','before','salary'); head(adultdata,3)
ans=3×15 table
age workClass education education_num marital_status occupation relationship race sex capital_gain capital_loss hours_per_week native_country fnlwgt salary
___ ________________ _________ _____________ __________________ _________________ _____________ _____ ____ ____________ ____________ ______________ ______________ __________ ______
39 State-gov Bachelors 13 Never-married Adm-clerical Not-in-family White Male 2174 0 40 United-States 77516 <=50K
50 Self-emp-not-inc Bachelors 13 Married-civ-spouse Exec-managerial Husband White Male 0 0 13 United-States 83311 <=50K
38 Private HS-grad 9 Divorced Handlers-cleaners Not-in-family White Male 0 0 40 United-States 2.1565e+05 <=50K
Rank the predictors in adultdata
. Specify the column salary
as a response variable, and specify the column fnlwgt
as observation weights.
[idx,scores] = fscchi2(adultdata,'salary','Weights','fnlwgt');
The values in scores
are the negative logs of the p-values. If a p-value is smaller than eps(0)
, then the corresponding score value is Inf
. Before creating a bar plot, determine whether scores
includes Inf
values.
idxInf = find(isinf(scores))
idxInf = 1×8
1 3 4 5 6 7 10 12
scores
includes eight Inf
values.
Create a bar plot of predictor importance scores. Use the predictor names for the x-axis tick labels.
figure bar(scores(idx)) xlabel('Predictor rank') ylabel('Predictor importance score') xticklabels(strrep(adultdata.Properties.VariableNames(idx),'_','\_')) xtickangle(45)
The bar
function does not plot any bars for the Inf
values. For the Inf
values, plot bars that have the same length as the largest finite score.
hold on bar(scores(idx(length(idxInf)+1))*ones(length(idxInf),1)) legend('Finite Scores','Inf Scores') hold off
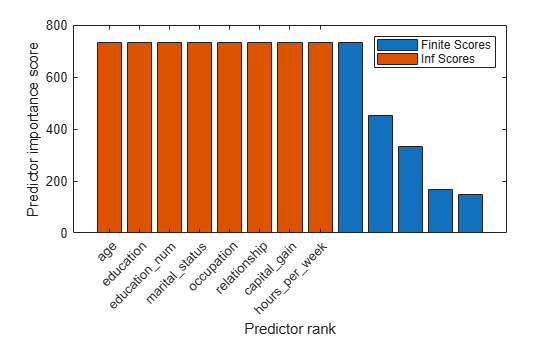
The bar graph displays finite scores and Inf scores using different colors.
Tbl
— Sample dataSample data, specified as a table. Multicolumn variables and cell arrays other than cell arrays of character vectors are not allowed.
Each row of Tbl
corresponds to one observation, and each column corresponds
to one predictor variable. Optionally, Tbl
can contain additional
columns for a response variable and observation weights.
A response variable can be a categorical, character, or string array, logical or numeric vector, or cell array of character vectors. If the response variable is a character array, then each element of the response variable must correspond to one row of the array.
If Tbl
contains the response variable, and you want to use
all remaining variables in Tbl
as predictors, then specify
the response variable by using ResponseVarName
. If
Tbl
also contains the observation weights, then you can
specify the weights by using Weights
.
If Tbl
contains the response variable, and you want to use only a subset of the remaining variables in Tbl
as predictors, then specify the subset of variables by using formula
.
If Tbl
does not contain the response variable, then specify
a response variable by using Y
. The response variable and
Tbl
must have the same number of rows.
If fscchi2
uses a subset of variables in Tbl
as
predictors, then the function indexes the predictors using only the subset. The values
in the 'CategoricalPredictors'
name-value pair argument and the
output argument idx
do not count the predictors that the function
does not rank.
fscchi2
considers NaN
, ''
(empty character vector), ""
(empty string),
<missing>
, and <undefined>
values
in Tbl
for a response variable to be missing values.
fscchi2
does not use observations with missing values for a
response variable.
Data Types: table
ResponseVarName
— Response variable nameTbl
Response variable name, specified as a character vector or string scalar containing the name of a variable in Tbl
.
For example, if a response variable is the column Y
of
Tbl
(Tbl.Y
), then specify
ResponseVarName
as
'Y'
.
Data Types: char
| string
formula
— Explanatory model of response variable and subset of predictor variablesExplanatory model of the response variable and a subset of the predictor variables, specified
as a character vector or string scalar in the form 'Y ~ x1 + x2 +
x3'
. In this form, Y
represents the response variable, and
x1
, x2
, and x3
represent
the predictor variables.
To specify a subset of variables in Tbl
as predictors, use a formula. If
you specify a formula, then fscchi2
does not rank any variables
in Tbl
that do not appear in formula
.
The variable names in the formula must be both variable names in
Tbl
(Tbl.Properties.VariableNames
) and valid
MATLAB® identifiers. You can verify the variable names in Tbl
by using the isvarname
function. If the variable
names are not valid, then you can convert them by using the matlab.lang.makeValidName
function.
Data Types: char
| string
Y
— Response variableResponse variable, specified as a numeric, categorical, or logical vector, a character or
string array, or a cell array of character vectors. Each row of Y
represents the labels of the corresponding row of X
.
fscchi2
considers NaN
, ''
(empty character vector), ""
(empty string),
<missing>
, and <undefined>
values
in Y
to be missing values. fscchi2
does
not use observations with missing values for Y
.
Data Types: single
| double
| categorical
| logical
| char
| string
| cell
X
— Predictor dataPredictor data, specified as a numeric matrix. Each row of X
corresponds to one observation, and each column corresponds to one predictor variable.
Data Types: single
| double
Specify optional
comma-separated pairs of Name,Value
arguments. Name
is
the argument name and Value
is the corresponding value.
Name
must appear inside quotes. You can specify several name and value
pair arguments in any order as
Name1,Value1,...,NameN,ValueN
.
'NumBins',20,'UseMissing',true
sets the number of bins as 20
and specifies to use missing values in predictors for ranking.'CategoricalPredictors'
— List of categorical predictors'all'
List of categorical predictors, specified as one of the values in this table.
Value | Description |
---|---|
Vector of positive integers |
Each entry in the vector is an index value corresponding to the column of the predictor data that contains a categorical variable. The index values are between 1 and If |
Logical vector |
A |
Character matrix | Each row of the matrix is the name of a predictor variable. The
names must match the names in Tbl . Pad the
names with extra blanks so each row of the character matrix has the
same length. |
String array or cell array of character vectors | Each element in the array is the name of a predictor variable.
The names must match the names in Tbl . |
'all' | All predictors are categorical. |
By default, if the predictor data is in a table
(Tbl
), fscchi2
assumes that a variable is
categorical if it is a logical vector, unordered categorical vector, character array, string
array, or cell array of character vectors. If the predictor data is a matrix
(X
), fscchi2
assumes that all predictors are
continuous. To identify any other predictors as categorical predictors, specify them by using
the 'CategoricalPredictors'
name-value argument.
Example: 'CategoricalPredictors','all'
Data Types: single
| double
| logical
| char
| string
| cell
'ClassNames'
— Names of classes to use for rankingNames of the classes to use for ranking, specified as the comma-separated pair consisting of 'ClassNames'
and a categorical, character, or string array, a logical or numeric vector, or a cell array of character vectors. ClassNames
must have the same data type as Y
or the response variable in Tbl
.
If ClassNames
is a character array, then each element must correspond to
one row of the array.
Use 'ClassNames'
to:
Specify the order of the Prior
dimensions that corresponds to the class order.
Select a subset of classes for ranking. For example, suppose that the set of all distinct class names in Y
is {'a','b','c'}
. To rank predictors using observations from classes 'a'
and 'c'
only, specify 'ClassNames',{'a','c'}
.
The default value for 'ClassNames'
is the set of all distinct class names in Y
or the response variable in Tbl
. The default 'ClassNames'
value has mathematical ordering if the response variable is ordinal. Otherwise, the default value has alphabetical ordering.
Example: 'ClassNames',{'b','g'}
Data Types: categorical
| char
| string
| logical
| single
| double
| cell
'NumBins'
— Number of bins for binning continuous predictorsNumber of bins for binning continuous predictors, specified as the comma-separated pair consisting of 'NumBins'
and a positive integer scalar.
Example: 'NumBins',50
Data Types: single
| double
'Prior'
— Prior probabilities'empirical'
(default) | 'uniform'
| vector of scalar values | structurePrior probabilities for each class, specified as one of the following:
Character vector or string scalar.
Vector (one scalar value for each class). To specify the class order for the
corresponding elements of 'Prior'
, set the
'ClassNames'
name-value argument.
Structure S
with two fields.
S.ClassNames
contains the class names as a variable
of the same type as the response variable in Y
or
Tbl
.
S.ClassProbs
contains a vector of corresponding
probabilities.
fscchi2
normalizes the weights in each class
('Weights'
) to add up to the value of the prior probability of
the respective class.
Example: 'Prior','uniform'
Data Types: char
| string
| single
| double
| struct
'UseMissing'
— Indicator for whether to use or discard missing values in predictorsfalse
(default) | true
Indicator for whether to use or discard missing values in predictors, specified as the
comma-separated pair consisting of 'UseMissing'
and either
true
to use or false
to discard missing values
in predictors for ranking.
fscchi2
considers NaN
,
''
(empty character vector), ""
(empty
string), <missing>
, and <undefined>
values to be missing values.
If you specify 'UseMissing',true
, then
fscchi2
uses missing values for ranking. For a categorical
variable, fscchi2
treats missing values as an extra category.
For a continuous variable, fscchi2
places
NaN
values in a separate bin for binning.
If you specify 'UseMissing',false
, then
fscchi2
does not use missing values for ranking. Because
fscchi2
computes importance scores individually for each
predictor, the function does not discard an entire row when values in the row are
partially missing. For each variable, fscchi2
uses all values
that are not missing.
Example: 'UseMissing',true
Data Types: logical
'Weights'
— Observation weightsones(size(X,1),1)
(default) | vector of scalar values | name of variable in Tbl
Observation weights, specified as the comma-separated pair consisting of
'Weights'
and a vector of scalar values or the name of a variable
in Tbl
. The function weights the observations in each row of
X
or Tbl
with the corresponding value in
Weights
. The size of Weights
must equal the
number of rows in X
or Tbl
.
If you specify the input data as a table Tbl
, then
Weights
can be the name of a variable in Tbl
that contains a numeric vector. In this case, you must specify
Weights
as a character vector or string scalar. For example, if
the weight vector is the column W
of Tbl
(Tbl.W
), then specify 'Weights,'W'
.
fscchi2
normalizes the weights in each class to add up to the value of the prior probability of the respective class.
Data Types: single
| double
| char
| string
idx
— Indices of predictors ordered by predictor importanceIndices of predictors in X
or Tbl
ordered by
predictor importance, returned as a 1-by-r numeric vector, where
r is the number of ranked predictors.
If fscchi2
uses a subset of variables in Tbl
as
predictors, then the function indexes the predictors using only the subset. For example,
suppose Tbl
includes 10 columns and you specify the last five
columns of Tbl
as the predictor variables by using
formula
. If idx(3)
is 5
,
then the third most important predictor is the 10th column in Tbl
,
which is the fifth predictor in the subset.
scores
— Predictor scoresPredictor scores, returned as a 1-by-r numeric vector, where r is the number of ranked predictors.
A large score value indicates that the corresponding predictor is important.
For example, suppose Tbl
includes 10 columns and you specify the last
five columns of Tbl
as the predictor variables by using
formula
. Then, score(3)
contains the score
value of the 8th column in Tbl
, which is the third predictor in the
subset.
fscchi2
examines whether each predictor variable is independent
of a response variable by using individual chi-square tests. A small
p-value of the test statistic indicates that the corresponding
predictor variable is dependent on the response variable, and, therefore is an important
feature.
The output scores
is –log(p). Therefore, a large score value indicates that the corresponding
predictor is important. If a p-value is smaller than
eps(0)
, then the output is Inf
.
fscchi2
examines a continuous variable after binning, or
discretizing, the variable. You can specify the number of bins using the
'NumBins'
name-value pair argument.
You have a modified version of this example. Do you want to open this example with your edits?
You clicked a link that corresponds to this MATLAB command:
Run the command by entering it in the MATLAB Command Window. Web browsers do not support MATLAB commands.
Choose a web site to get translated content where available and see local events and offers. Based on your location, we recommend that you select: .
Select web siteYou can also select a web site from the following list:
Select the China site (in Chinese or English) for best site performance. Other MathWorks country sites are not optimized for visits from your location.