Explore Metric Results, Monitor Progress, and Identify Issues
R2026bYou can view metrics for your Model-Based Design artifacts, assess the current status of a project, and identify and fix noncompliant metric results by using the Simulink® Check™ dashboards. You can use the dashboards to visualize the metric results or collect the metric results programmatically. You can also save reports for offline review of metric results.
The dashboards and metric results provide an overview of model quality and the project verification status. Use the detailed metric results to identify specific artifacts that are not in compliance with industry standards and guidelines. The dashboard summarizes metric results so you can track progress and identify gaps. As you update, refactor, and fix artifacts, return to the dashboard to monitor your progress towards fixing noncompliant artifacts or gaps in requirements-based testing.
Metric Results in the Dashboards
There are different types of dashboards:
Model Design Dashboard — Review design structure, diagnostics, and reuse.
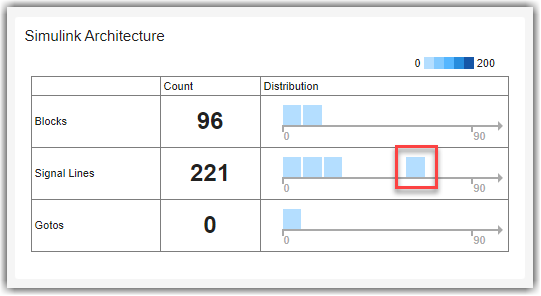
Model Maintainability Dashboard — Assess the size, architecture, and complexity of the models in your project.
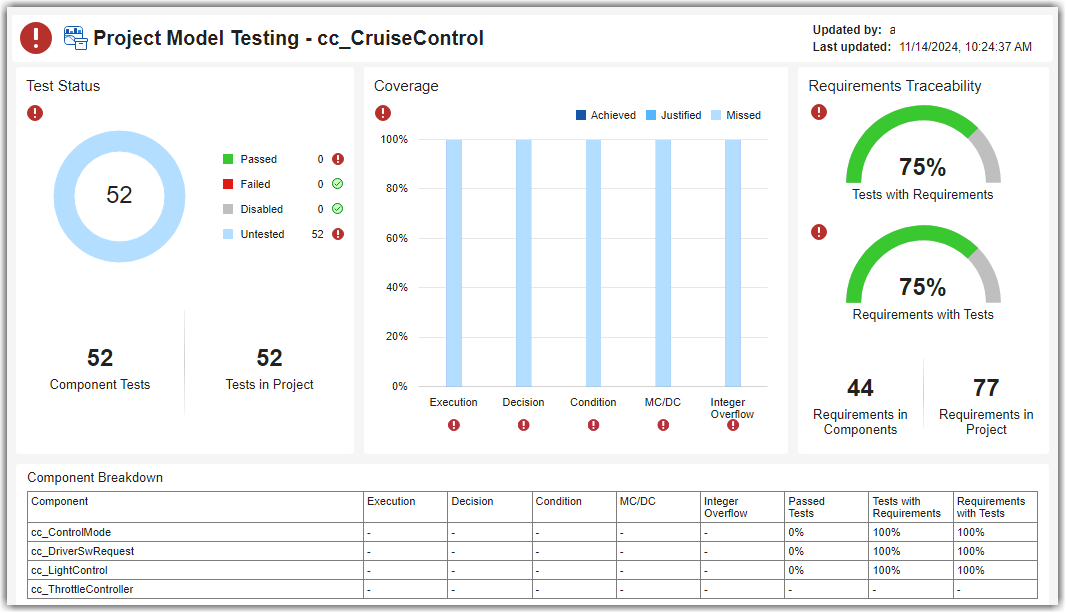
Project Model Testing Dashboard — Summarize the model testing, coverage, and requirements traceability across models in your project.
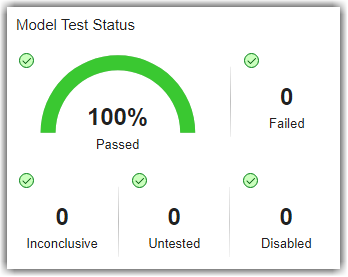
Model Testing Dashboard — Assess the model testing artifacts in your project.
SIL Code Testing and PIL Code Testing Dashboards — Assess the code testing artifacts in your project.
The following table shows examples of common dashboard results, the associated dashboard and metrics, and links to related examples.
Note
If you currently use the Metrics Dashboard to review MATLAB® Code Analyzer warnings, Simulink diagnostics, and reuse metrics, consider using the new Model Design Dashboard instead. The Metrics Dashboard will be removed in a future release.
| Dashboard | Dashboard Results | Dashboard and Metric Examples | Guidelines and Standards |
|---|---|---|---|
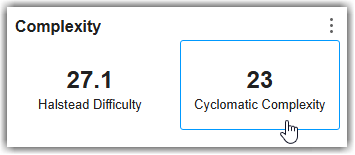
| Model Design Dashboard | View an overview of the composition, complexity, and dimensions of a unit.
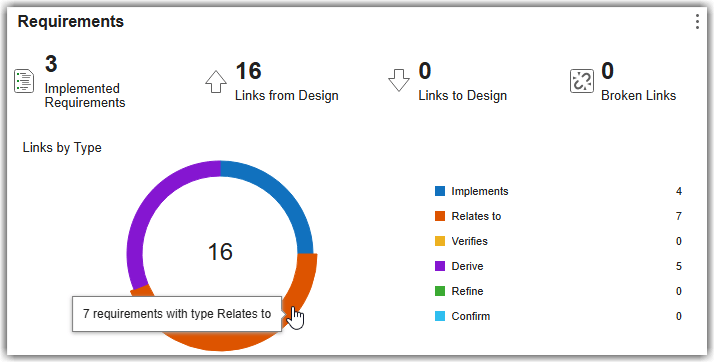
Assess the total number of links and the distribution of link types for a unit.
| Use the Model Design Dashboard to visualize the metric results or collect results programmatically with the model design metrics. For more information, see:
| The Model Design Dashboard summarizes model maintainability metric results from the Model Maintainability Dashboard. For information on the model testing metrics and ISO 26262, see Assess Model Size and Complexity for ISO 26262. |
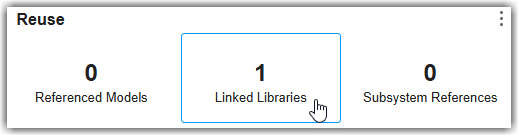
Identify parts of your model that use library content to reuse existing modeling components or parts of your model that you can potentially refactor to reuse modeling components.
| |||
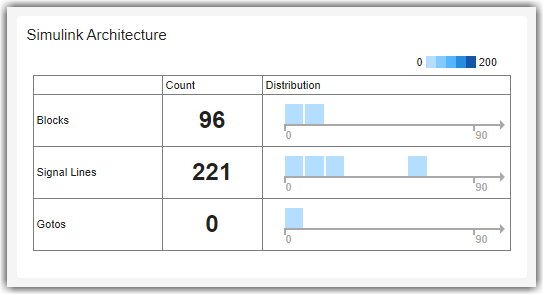
| Model Maintainability Dashboard | View the overall architecture of the Simulink, Stateflow®, and MATLAB artifacts in your project.
| Use the Model Maintainability Dashboard to visualize the metric results or collect results programmatically with the model maintainability metrics. For more information, see:
| Assess Model Size and Complexity for ISO 26262 |
Pinpoint areas in the design that have high complexity.
| |||
| Project Model Testing Dashboard | Assess the status and quality of models in your project.
| Use the Project Model Testing dashboard to view a summary of the test statuses, model coverage, and requirements traceability for the individual components in your design. For more information, see Summarize Status of Testing for Project. | The Project Model Testing dashboard summarizes model testing metric results from the Model Testing Dashboard. For information on the model testing metrics and ISO 26262, see Assess Requirements-Based Testing for ISO 26262. |
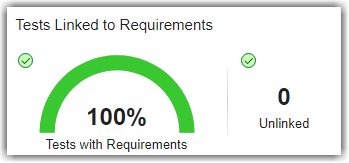
| Model Testing Dashboard | Trace the relationships between models, requirements, and tests.
| Use the Model Testing Dashboard to visualize the metric results or collect results programmatically with the model testing metrics. For more information, see:
| Assess Requirements-Based Testing for ISO 26262 |
View the current status of model testing and identify gaps in test results.
| |||
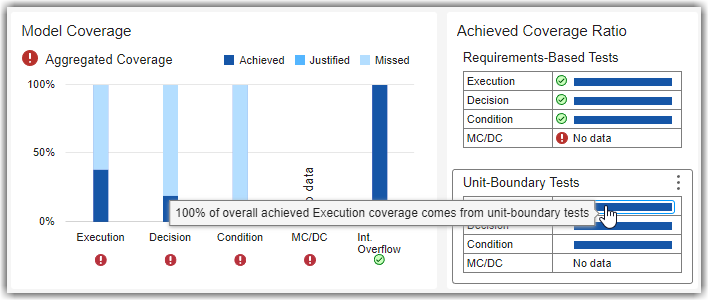
View the overall achieved model coverage and monitor the sources of coverage.
| |||
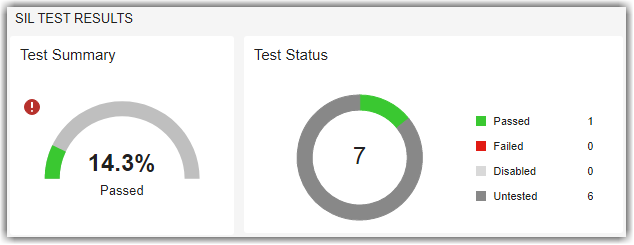
| SIL Code Testing and PIL Code Testing Dashboards | View the current status of code testing and identify gaps in test results.
| Use the SIL Code Testing and PIL Code Testing dashboards to visualize the metric results or collect results programmatically with the code testing metrics. For more information, see:
| Identify and Troubleshoot Gaps in Code Testing Results and Coverage |
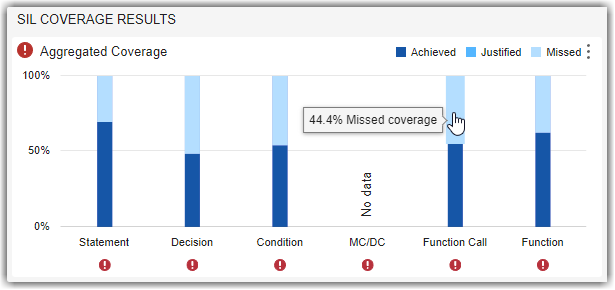
View the overall achieved code coverage and monitor the sources of coverage.
| |||
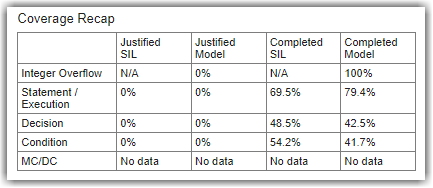
Identify issues across model and code testing results.
|