Assess Model Design Using Model Design Dashboard
R2026bThe Model Design Dashboard helps you assess the overall quality of your model design. Use the dashboard to get a high-level overview of design size, complexity, requirements traceability, diagnostics, and reuse to identify areas for improvement.
Use the Model Design Dashboard to:
Assess the size and composition of your design across Simulink®, Stateflow®, and MATLAB® code.
View complexity metrics and drill down to the Model Maintainability Dashboard for detailed architecture and decision path analysis.
Review requirements traceability, including implemented requirements, link types, and broken links.
Check recent compile results and code issues from the MATLAB Code Analyzer.
Identify opportunities for reuse through referenced models, linked libraries, subsystem references, and clone detection results.
Open the Model Design Dashboard
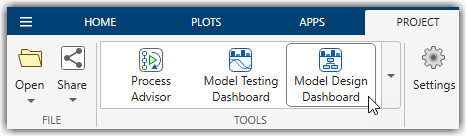
To open the Model Design Dashboard, open a project that contains the models that you want to analyze. Then, in the Project tab, in the Tools menu, under Apps, select Model Design Dashboard.
The first time that you open a project, the dashboard prompts you to enable artifact tracing so that it detects outdated metric results. Click Enable and Continue.
By default, the dashboard analyzes all models inside the project folder and considers Simulink models as units. A unit is a functional entity in your software architecture that you can execute and test independently or as part of larger system tests.
Software development standards, such as ISO 26262-6, often define objectives for units. For information on how to control which models appear as units, see Categorize Models in Hierarchy as Components or Units.
The dashboard opens for the first unit model in the Project panel. To view a different unit, select it from the Project panel on the left. To explore the artifacts associated with a model in more detail, such as requirements, tests, and test results, use the Artifacts panel.
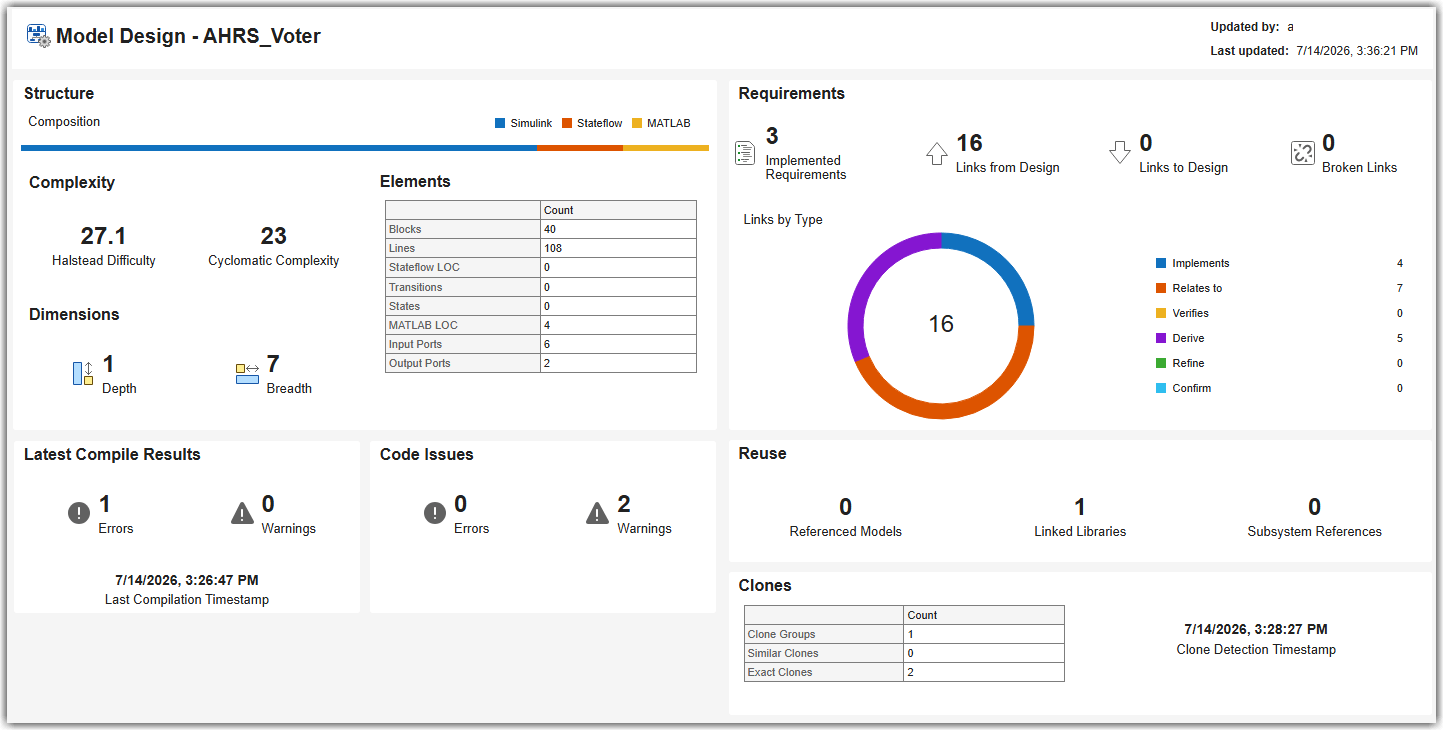
The Model Design Dashboard has six main sections. Each section contains widgets with a context menu (...) that provides options such as viewing help or opening related tools. Some sections have a single context menu for the entire section, while others have separate context menus for individual widgets.
Structure and Complexity
The Structure section shows the composition, complexity, and dimensions of the selected unit design.
Composition
The Composition bar shows the number of elements in the unit by domain: Simulink, Stateflow, and MATLAB. Point to a bar segment to see the element count for that domain, or select a segment to open the Model Maintainability Dashboard for a detailed breakdown.

Complexity
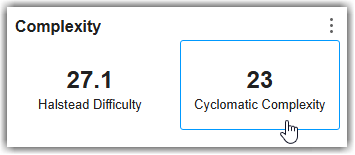
The Complexity area summarizes the logic and structural complexity of the selected unit design.
Halstead Difficulty reflects how difficult the design logic is to read and write, based on the size and usage of operators and operands across Simulink, Stateflow, and MATLAB. Higher values indicate dense logic that might be harder to maintain.
Cyclomatic Complexity reflects the number of possible execution paths through the design. Higher values indicate more decision paths, which increase the effort required to test and maintain the design.
Select either widget to open the Model Maintainability Dashboard for a detailed breakdown of complexity sources.
Dimensions
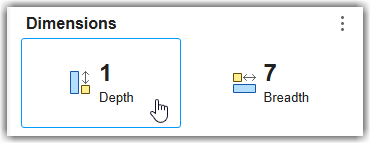
The Dimensions area summarizes the depth and breadth of the selected unit design.
Depth shows the maximum number of nested model layers. A higher value indicates more levels of hierarchy, which can make the design harder to follow.
Breadth shows the maximum number of child model layers contained in a single layer. A higher value indicates a layer with many elements.
Select either widget to open the Model Maintainability Dashboard for a detailed structural breakdown.
Elements
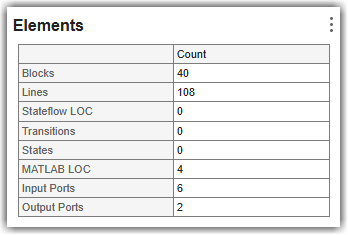
The Elements table shows the count of each element type in the unit, including blocks, lines, Stateflow lines of code (LOC), transitions, states, MATLAB LOC, input ports, and output ports. Use this table to understand the size and makeup of the unit design.
Requirements
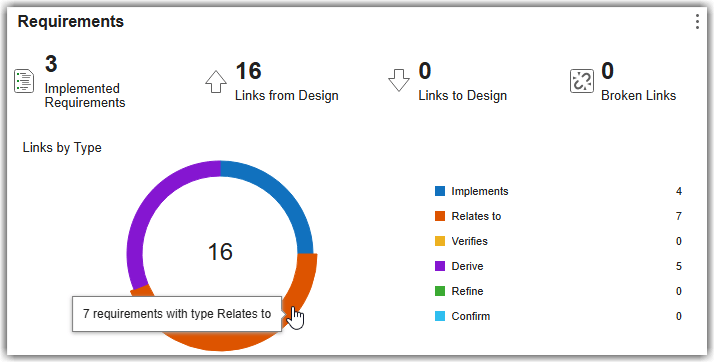
The Requirements section summarizes how the selected unit traces to requirements and highlights the status of those links.
At the top of the section:
Implemented Requirements shows the number of requirements that the unit implements.
Links from Design shows the number of requirement links originating from design elements.
Links to Design shows the number of requirement links targeting design elements.
Broken Links shows requirement links that are unresolved.
Select a widget to display a table with detailed information, including the relevant requirements, link elements, link direction, link type, and whether each link is resolved. You can open a requirement or link in Requirements Editor by using the hyperlinks in the table.
The Links by Type chart shows the total number of links and the distribution of link types for the selected unit.
Latest Compile Results
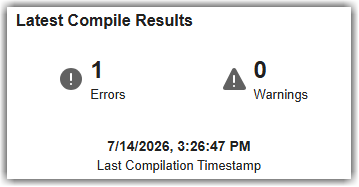
The Latest Compile Results section summarizes the outcome of the most recent model compilation for the selected unit.
Errors shows the number of compile-time errors.
Warnings shows the number of compile-time warnings.
Last Compilation Timestamp shows when the unit was most recently compiled.
If you have not yet compiled the unit, this section shows no data. These results reflect only compilations that you start by updating the Simulink diagram. The dashboard does not include diagnostics from simulation, linking, or other implicit compilations.
When a model references other models, compiling the top model aggregates diagnostics from the entire reference hierarchy. Referenced models do not show compilation results unless you compile them individually.
Code Issues
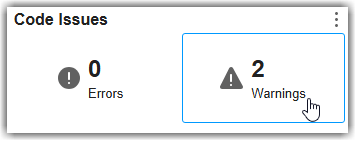
The Code Issues section summarizes issues found by the MATLAB Code Analyzer for the selected unit.
Errors shows the number of error messages.
Warnings shows the number of warning messages.
Select a widget to display a table that lists the MATLAB files or functions where the Code Analyzer found issues, along with the number of errors, warnings, and informational messages for each element. You can open an element by using the hyperlink in the table.
For more information about the Code Analyzer, see Check Code for Errors and Warnings Using the Code Analyzer.
Reuse
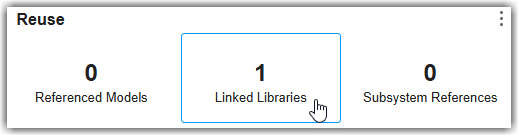
The Reuse section summarizes how the selected unit reuses existing design elements.
Referenced Models shows the number of models that the unit references.
Linked Libraries shows the number of library links that the unit uses.
Subsystem References shows the number of referenced subsystems that the unit uses.
Select a widget to display a table with hyperlinks to each of the reused elements.
Clones
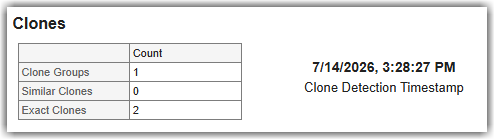
The Clones section summarizes similar or duplicated design patterns that the Clone Detector found for the selected unit.
Clone Groups shows how many sets of repeated modeling patterns the Clone Detector found. Each clone group contains either exact or similar clones that you can analyze or refactor together.
Similar Clones shows the number of clones that have identical block types and signal connections, but with at least one differing block parameter value.
Exact Clones shows the number of clones that have identical block types, signal connections, and block parameter values.
The Clone Detection Timestamp indicates when you last ran Clone Detector.
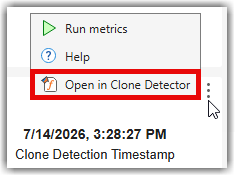
To view clone details for the current unit, point to the Clones section and click ... > Open in Clone Detector. For more information about clone detection, see Enable Component Reuse by Using Clone Detection.
Collect Results and Explore Other Dashboards
When the dashboard detects changes to artifacts since the last metric collection, a warning banner appears at the top of the dashboard. Click Collect in the warning banner to refresh the metric results. Widgets with potentially outdated results display a stale indicator.

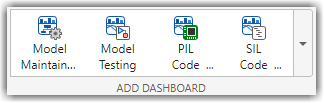
To assess more detailed model maintainability metrics, such as architecture and decision paths, open the Model Maintainability Dashboard. On the Dashboard tab, in the Add Dashboard section, select Model Maintainability. For more information, see Monitor Design Complexity Using Model Maintainability Dashboard. The gallery also includes other dashboards, such as the Model Testing Dashboard, which assesses the status and quality of model testing.
Additionally, you can also collect metric results programmatically by using the metric.Engine

