Design Custom Image Displays Based on Signal Value Ranges
R2026bThis example shows how to display an image that depends on the value of a signal during simulation. The model in this example uses the MultiStateImage block to represent different stages of a battery-charging process by displaying different images as the input signal moves through specified ranges.
Examine the CustomMultiStateImage model.
open_system("CustomMultiStateImage.slx");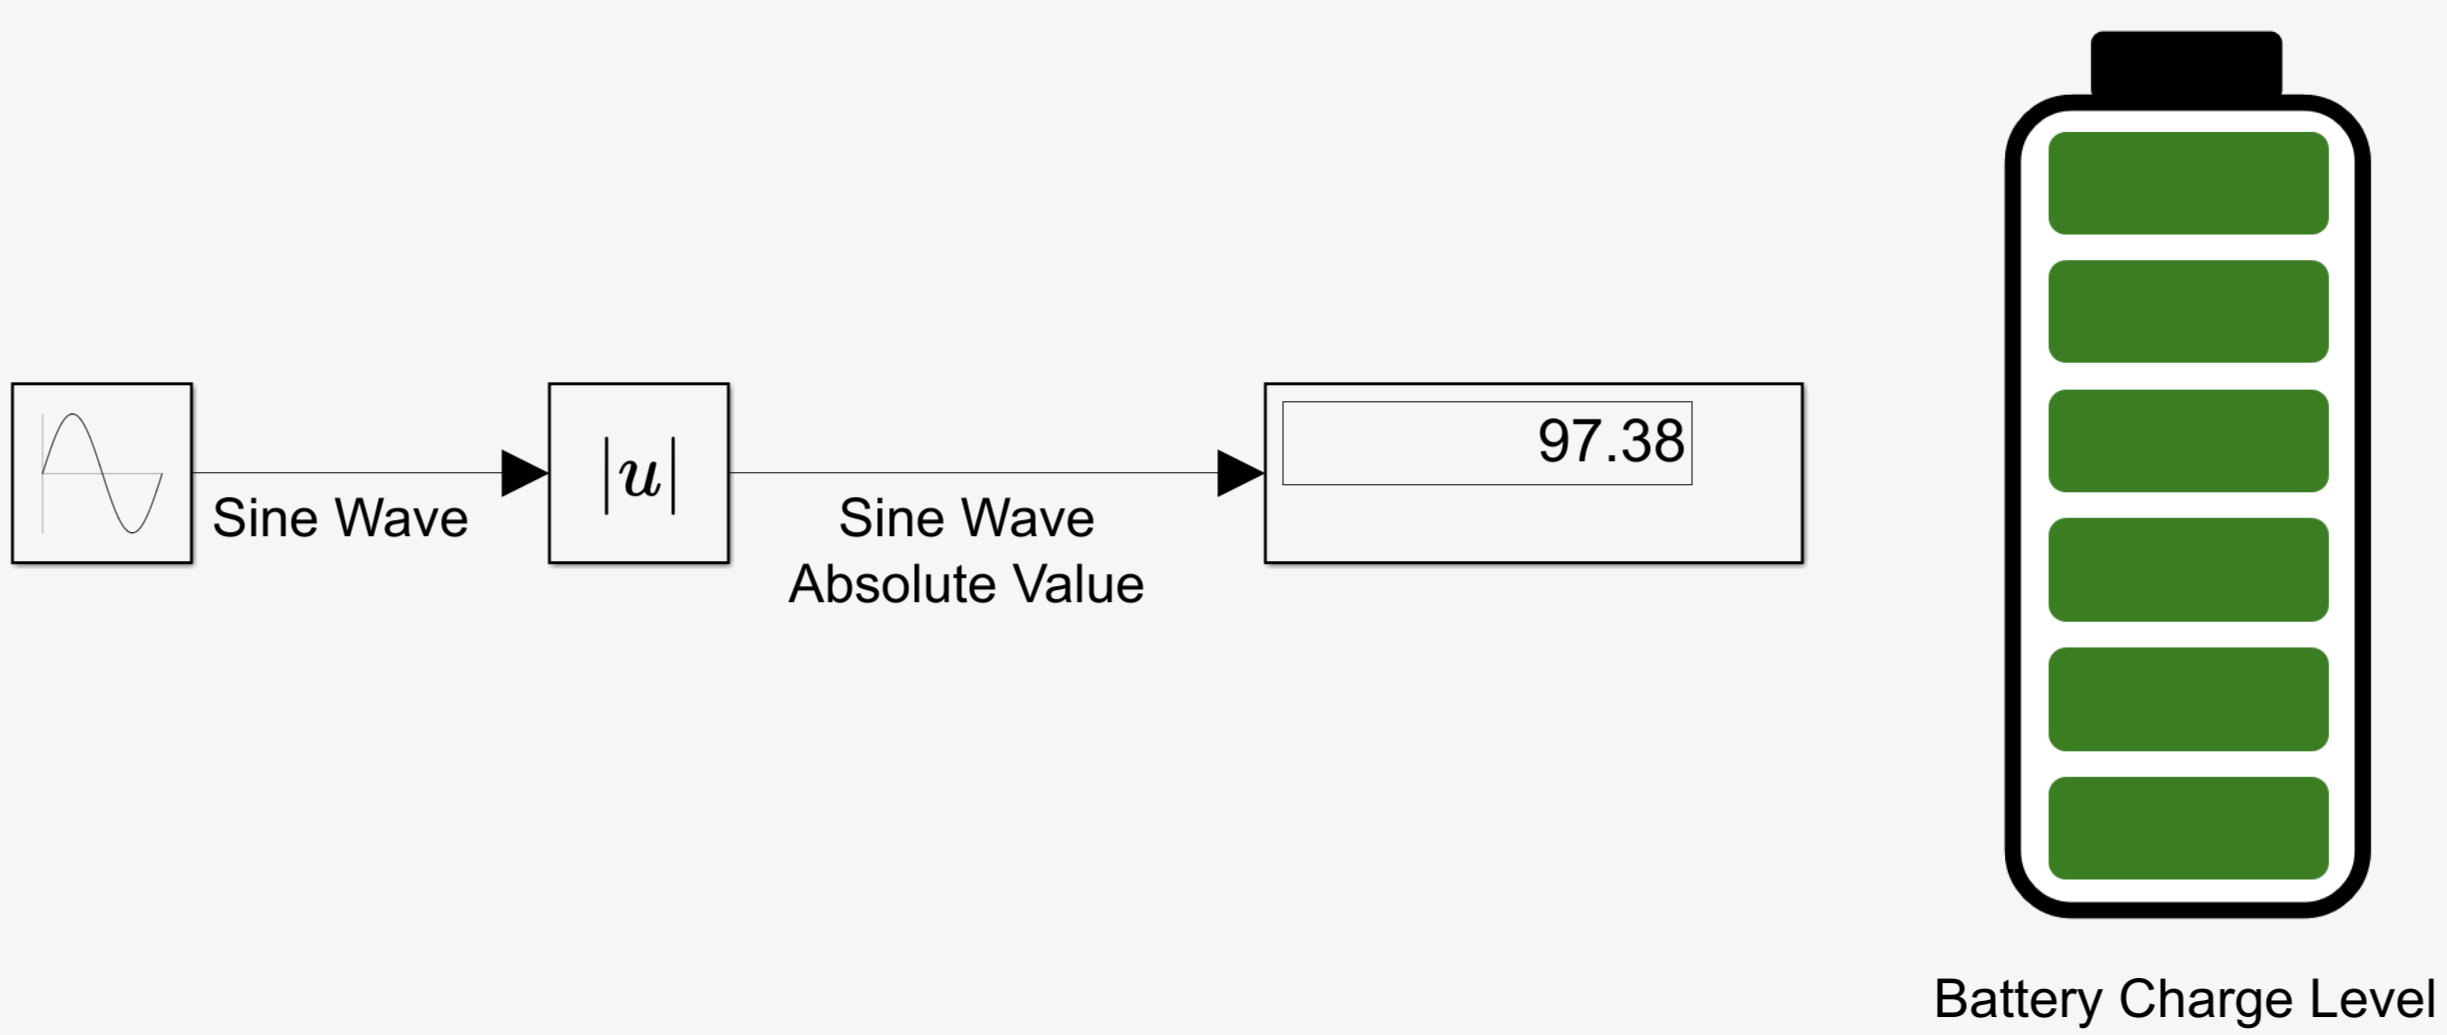
To create a display like the one in the example model, add a customizable MultiStateImage block to your model. Double-click the model canvas and begin typing MultiStateImage. Select the search result with the library path Simulink/Dashboard/Customizable Blocks.
To use the MultiStateImage block, you define a set of states with corresponding images. Configure the block to specify each state as a range of input values.
In the model canvas, select the MultiStateImage block.
In the Simulink® Toolstrip, on the Modeling tab, in the Design gallery, select Property Inspector.
On Property Inspector, on the Parameters tab, select the Specify State Values as Ranges check box.
In the example model, the state ranges are defined as shown in this image.
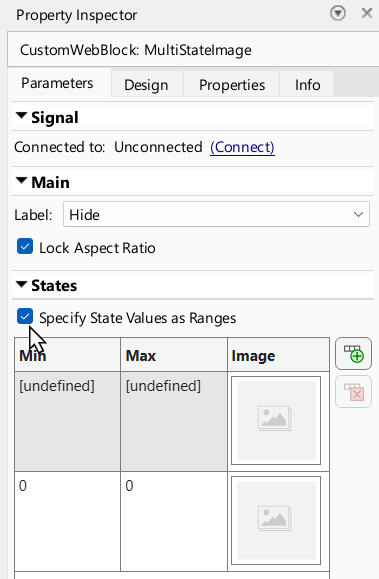
To add images and specify the range of values for each image:
Double-click the thumbnail icon under Image in the row with
[undefined]value ranges.Navigate to the location of the image you want and select it. In this example, the images are in the
CustomMultiStateImagefolder, and the first defined state is associated with theBattery_0.pngfile.Double-click the thumbnail icon in the second row and select an image for the second define state. In this example, the image is
Battery_20.png.Click
 to add five additional state rows.
Double-click the thumbnail icon in each additional state row, and select the remaining battery images.
Enter the minimum and maximum input values for each image in the Min and Max columns.
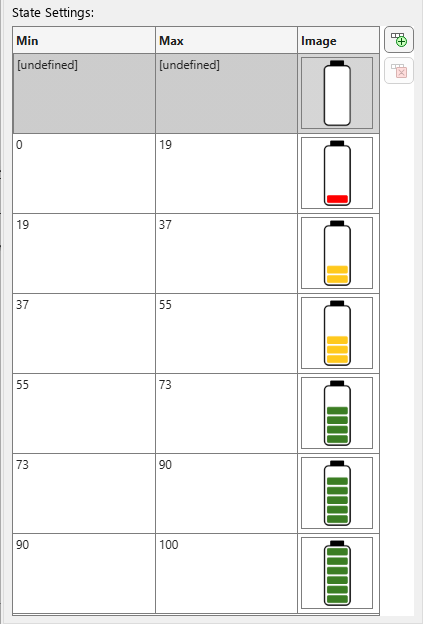
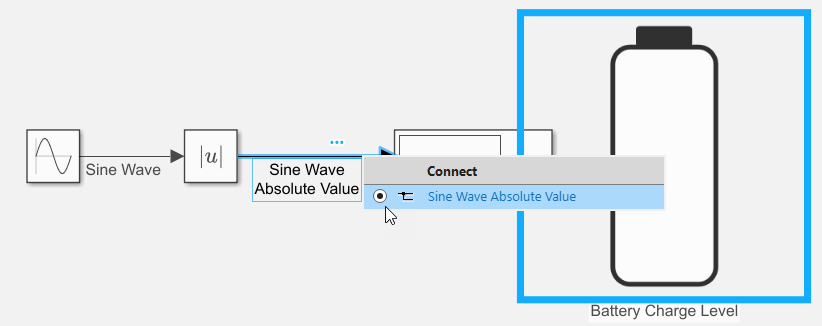
In the model, a Sine Wave block connected to an Abs block generates a signal that represents the battery status. Connect the MultiStateImage block to the Sine Wave Absolute Value signal.
Select the MultiStateImage block.
Click the Connect button
 that appears above the block.
Select the
Sine Wave Absolute Valuesignal output.Select the
Sine Wave Absolute Valueoption in the table that appears.Click the
Xin the upper right corner of the Simulink window to exit connect mode.
To see the MultiStateImage block display the battery images based on the value of the connected signal, simulate the model. The model uses simulation pacing to slow model execution to display the different battery states. For more information about simulation pacing, see Simulation Pacing Options.

