Implement Control Algorithm Using Enabled Subsystem
This example shows how to use an enabled subsystems to implement a control algorithm based on a binary logic signal. The enabled subsystems execute when the binary signal has a positive value and implements the control algorithm. In this example, the super-twisting control algorithm is used to stabilize an unstable dynamic system. The super-twisting algorithm is one of the well known sliding mode control techniques for its robust performance.
Open the model.
mdl = "enablesub.slx";
open_system(mdl)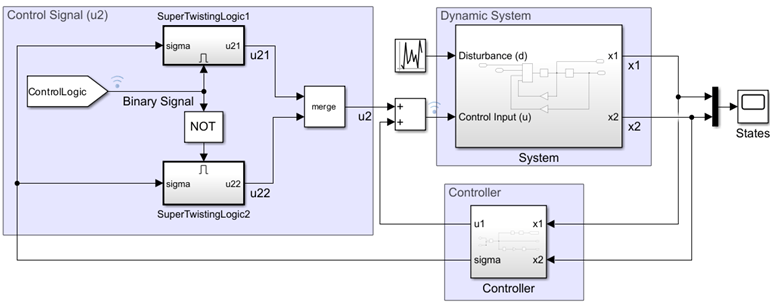
Dynamic System
The dynamic system under consideration is governed by the following equations:
is the control input and is the external disturbance.
Controller and Control Signal
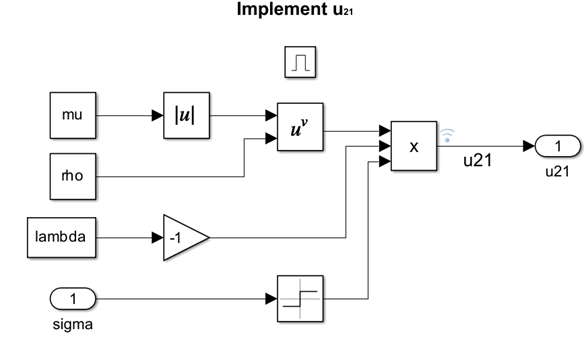
The control input () has two components, and , which are governed by the super-twisting algorithm. This logic-based design for is implemented using the enabled subsystem.
, and . These parameters are loaded from the model callback parameter, PreLoadFcn.

Run Simulation and Visualize Results
Run the simulation and visualize the results using a Scope block and Simulink Data Inspector.
out = sim(mdl);
Visualize Controller Input
The Simulink Data Inspector shows subsystem output based on the binary signal. The output and are the two components of controller gain .
The subsystem containing is enabled between 0 and 1.8 seconds and between 3 and 5 seconds.
The subsystem containing is enabled between 1.8 and 3 seconds and between 5 and 15 seconds.

State Output
The state output shows that the controller stabilizes the system.

See Also
Enabled Subsystem | From | Goto | Integrator | Saturation
Topics
References
[1] Shtessel, Yuri, Christopher Edwards, Leonid Fridman, and Arie Levant. "Sliding mode control and observation." Vol. 10. New York: Springer New York, 2014. https://link.springer.com/book/10.1007/978-0-8176-4893-0