Counters Using Conditionally Executed Subsystems
This example shows how to implement counters using Enabled and Triggered subsystems. In this example, the model sldemo_counters controls flow of water into a tank and uses a counter to count the number of times overflow occurs, where overflow occurs when the water level in the tank is 8 meters or more for 30 seconds or more.
In addition to counting the number of times overflow occurs, the Triggered subsystem also closes the valve to stop the flow of water into the tank to maintain the water level in the tank below the maximum allowable limit.
Open the model.
mdl = "sldemo_counters.slx";
open_system(mdl)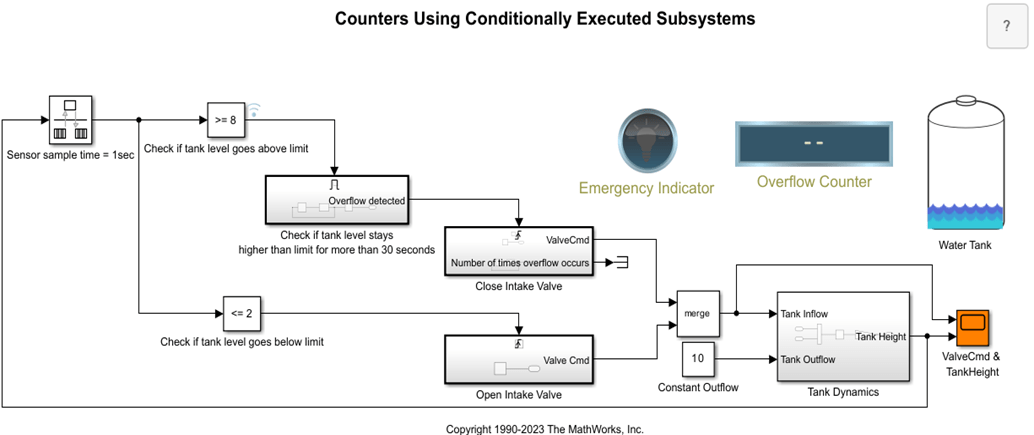
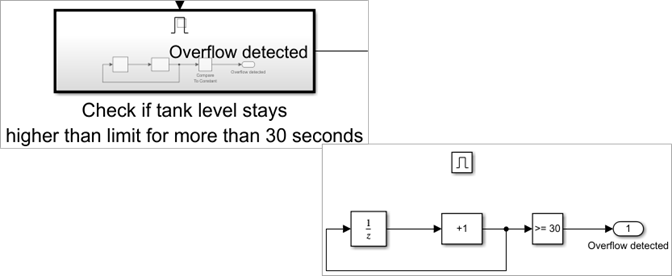
Counters Using Enabled Subsystem
The Enabled subsystem executes when the water level is equal to or more than 8 meters. A counter in the subsystem uses a Unit Delay block and a Bias block and checks if water stays at that level for 30 seconds or more. It indicates overflow by a positive output signal (Overflow Detected) value. The value activates the Trigger port of the Triggered subsystem Close Intake Valve.
Counters Using Triggered Subsystem
The model contains two Triggered subsystems:
Close Intake Valve This subsystem contains an algorithm that implements another counter using a Unit Delay and a Bias block that counts the number of times overflow occurs and closes the valve when overflow is detected. The counter uses a Unit Delay block and increases the value by 1 every time overflow is detected.

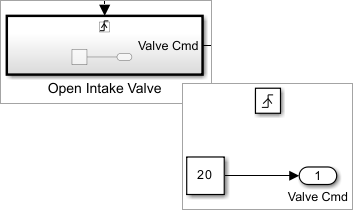
Open Intake valve When the water level in the tank drops below the minimum allowable limit of 2 meters, this subsystem is triggered. This subsystem contains an algorithm that opens the valve and allows water to flow into the tank.
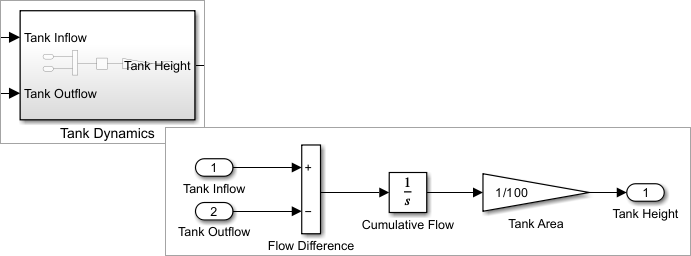
Tank Dynamics
The Tank Dynamics subsystem contains an algorithm that determines the water level in the tank based on the water inflow rate, outflow rate, and tank cross-sectional area. This algorithm implements the following equation.
Simulate the Model and Review Results
Simulate the model.
out = sim(mdl);
During the simulation, observe the following components:
Emergency Indicator A Lamp block is connected to the input signal (
control signal) of the Enabled subsystem block and turns red (on) when the water level equal to or more than 8 meters. In the absence of overflow, the indicator is green (off). For example, first time the indicator turns on around t =100s.Overflow Counter This counter uses a Display block that represents the number of times overflow occurs. For example, first time overflow is recorded at t =130s.
Water Tank This component uses a Horizontal Gauge block that represents the water level in the tank. During the simulation, it shows the change in water level in the tank.

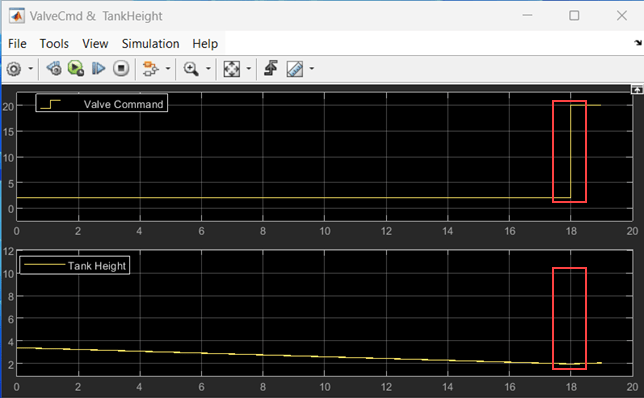
Scope block This component uses a Scope block to represent the water level at different time steps of the simulation and the corresponding valve open or close command.
During simulation, when water level in the tank drops down to 2 meters (for example at t =38s as indicated by a red rectangle), the intake valve opens and allows water to flow into the tank. To visualize, set the Stop Time to 40.
When water level in the tank reaches a height of 8 meters and for the next 30 seconds the water level remains at that height or more, overflow occurs. Subsequently, the valve closes to stop the flow of water into the tank. For an example, observe the simulation between t =100s and t =130s. To visualize, set the Stop Time to 140.

See Also
Enabled Subsystem | Triggered Subsystem