Create and Modify Subsystem Plots
This example shows how to create and modify plots in an equivalent baseband subsystem.
Plot Network Parameters of Subsystem
In this part of the example, you open and run a RF Blockset™ equivalent baseband example that uses data file to specify an amplifier in a physical subsystem. Then, you plot the network parameters of the physical subsystem, which consists of the General Amplifier, the Input Port, and the Output Port blocks.
Open the AMP Data File for Amplifier model.

In the model window, click Run to run the simulation.

Double-click the Output Port block to open the block mask. Select the Visualization tab and set the Output Port block parameters as follows:
Source of frequency data —
Derived from Input Port parametersPlot type —
X-Y planeY Parameter1 —
S21
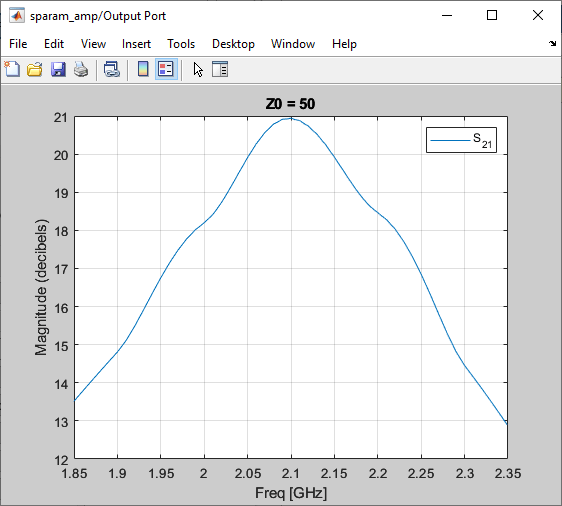
Click Plot to plot the magnitude of S21 (in decibels) as a function of frequency on an X-Y plot.

Add Data to Existing Plot
In this part of the example, you add data to the plot you created in Plot Network Parameters of Subsystem section.
Double-click the Output Port block to open the block mask. Select the Visualization tab and set the Y Parameter1 to S22. Click Plot to add S22 to the S21 plot.

Change Data on an Existing Plot
In this part of the example, you change the data on the plot you created in the previous steps of the example by modifying the Plot type.
Double-click the Output Port block to open the block mask. Select the Visualization tab and set Plot type to Polar plane. Click Plot to create a Polar plane plot of S22 as a function of frequency.

In the Output Port block, change the Plot type to Composite data to generate four plots in one figure. The parameters for the plots are defined by the block, so the Y Parameter1, Y Parameter2, and X Parameter parameters are not enabled.

Composite plot displays magnitude, phase, polar, and Z-Smith chart.