rpmfreqmap
Frequency-RPM map for order analysis
Syntax
Description
map = rpmfreqmap(x,fs,rpm)map, that results
from performing frequency analysis on the input vector, x. x is
measured at a set rpm of rotational speeds expressed
in revolutions per minute. fs is the sample rate
in Hz. Each column of map contains root-mean-square
(RMS) amplitude estimates of the spectral content present at each
value of rpm. rpmfreqmap uses
the short-time Fourier transform to analyze the spectral content of x.
map = rpmfreqmap(___,Name=Value)
rpmfreqmap(___) with no output
arguments plots the frequency map as a function of rotational speed
and time on an interactive figure. The plot is also known as a Campbell
diagram.
Examples
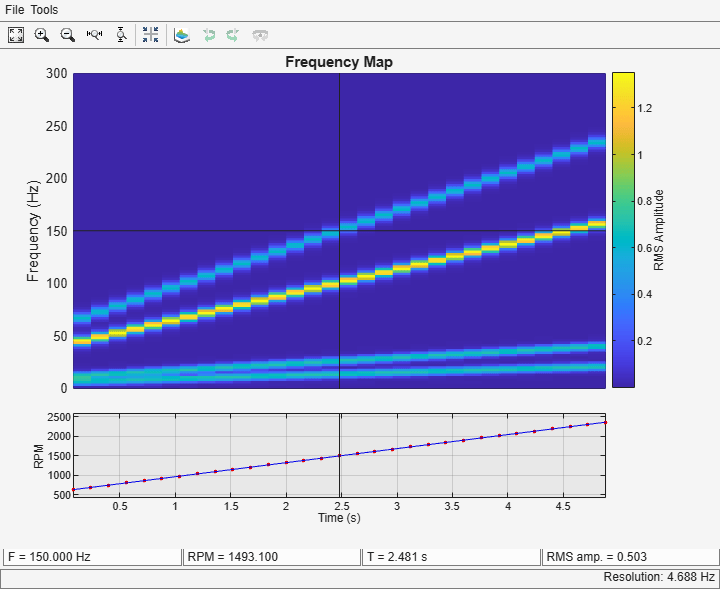
Create a simulated signal sampled at 600 Hz for 5 seconds. The system that is being tested increases its rotational speed from 10 to 40 revolutions per second during the observation period.
Generate the tachometer readings.
fs = 600;
t1 = 5;
t = 0:1/fs:t1;

f0 = 10;
f1 = 40;
rpm = 60*linspace(f0,f1,length(t));
The signal consists of four harmonically related chirps with orders 1, 0.5, 4, and 6. The order-4 chirp has twice the amplitude of the others. To generate the chirps, use the trapezoidal rule to express the phase as the integral of the rotational speed.
orderList = [1 0.5 4 6];
ph = 2*pi*cumtrapz(rpm/60)/fs;

x = [1 1 2 1]*cos(orderList'*ph);
Visualize the frequency-RPM map of the signal.
rpmfreqmap(x,fs,rpm)
Analyze simulated data from an accelerometer placed in the cockpit of a helicopter.
Load the helicopter data. The vibrational measurements, vib, are sampled at a rate of 500 Hz for 10 seconds. Inspection of the data reveals that it has a linear trend. Remove the trend to prevent it from degrading the quality of the frequency estimation.
load helidata.mat
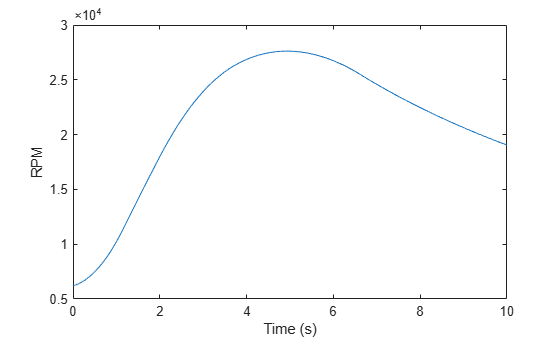
vib = detrend(vib);Plot the nonlinear RPM profile. The rotor runs up until it reaches a maximum rotational speed of about 27,600 revolutions per minute and then coasts down.
plot(t,rpm)
xlabel("Time (s)")
ylabel("RPM")
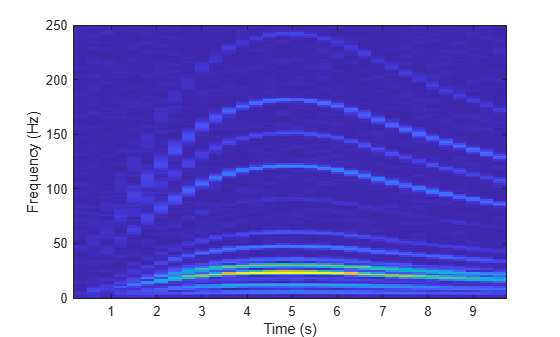
Compute the frequency-RPM map. Specify a resolution bandwidth of 2.5 Hz.
[map,freq,rpmOut,time] = rpmfreqmap(vib,fs,rpm,2.5);
Visualize the map.
imagesc(time,freq,map)
ax = gca;
ax.YDir = "normal";
xlabel("Time (s)")
ylabel("Frequency (Hz)")
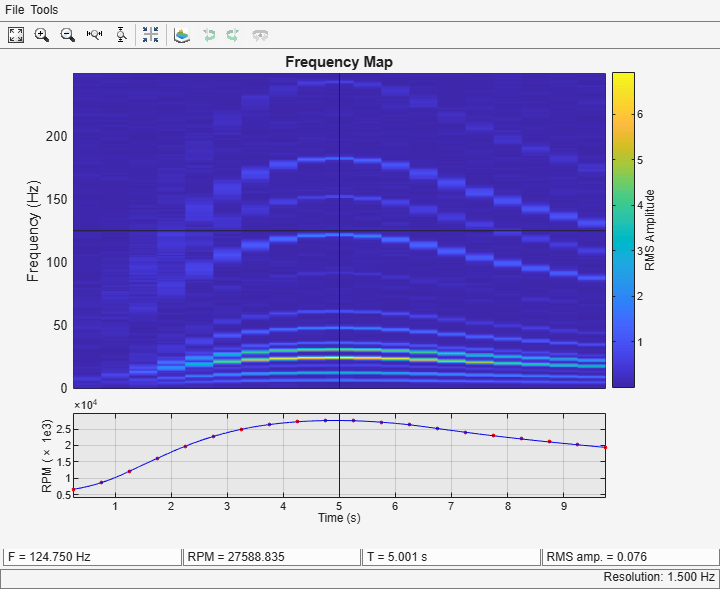
Repeat the computation using a finer resolution bandwidth. Plot the map using the built-in functionality of rpmfreqmap. The gain in frequency resolution comes at the expense of time resolution.
rpmfreqmap(vib,fs,rpm,1.5);
Generate a signal that consists of two linear chirps and a quadratic chirp, all sampled at 600 Hz for 15 seconds. The system that produces the signal increases its rotational speed from 10 to 40 revolutions per second during the testing period.
Generate the tachometer readings.
fs = 600;
t1 = 15;
t = 0:1/fs:t1;

f0 = 10;
f1 = 40;
rpm = 60*linspace(f0,f1,length(t));
The linear chirps have orders 1 and 2.5. The component with order 1 has half the amplitude of the other. The quadratic chirp starts at order 6 and returns to this order at the end of the measurement. Its amplitude is 0.8. Create the signal using this information.
o1 = 1;
o2 = 2.5;
o6 = 6;

x = 0.5*chirp(t,o1*f0,t1,o1*f1) + chirp(t,o2*f0,t1,o2*f1) + ...
    0.8*chirp(t,o6*f0,t1,o6*f1,"quadratic");
Compute the frequency-RPM map of the signal. Use the peak amplitude at each measurement cell. Specify a resolution of 6 Hz. Window the data with a flat top window.
[map,fr,rp] = rpmfreqmap(x,fs,rpm,6, ...
    Amplitude="peak",Window="flattopwin");
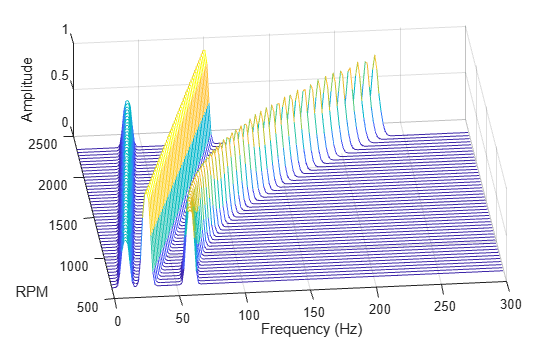
Draw the frequency-RPM map as a waterfall plot.
[FR,RP] = meshgrid(fr,rp);
waterfall(FR,RP,map')

view(-6,60)
xlabel("Frequency (Hz)")
ylabel("RPM")
zlabel("Amplitude")
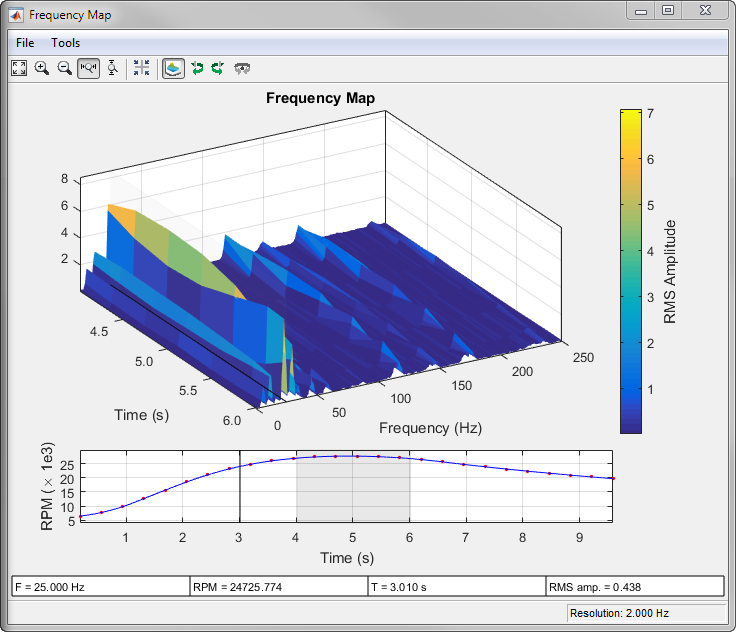
Plot an interactive frequency-RPM map by calling rpmfreqmap without
output arguments.
Load a file containing simulated vibrational data from an accelerometer placed in the cockpit
of a helicopter. The data is sampled at a rate of 500 Hz for 10 seconds.
Remove the linear trend in the data. Call rpmfreqmap to
generate an interactive plot of the frequency-RPM map. Specify a frequency
resolution of 2
Hz.
load helidata.mat
rpmfreqmap(detrend(vib),fs,rpm,2)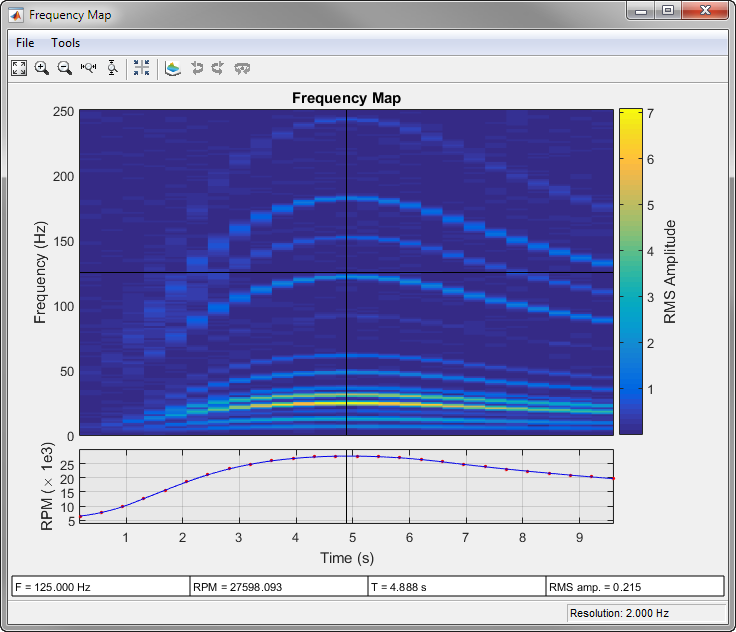
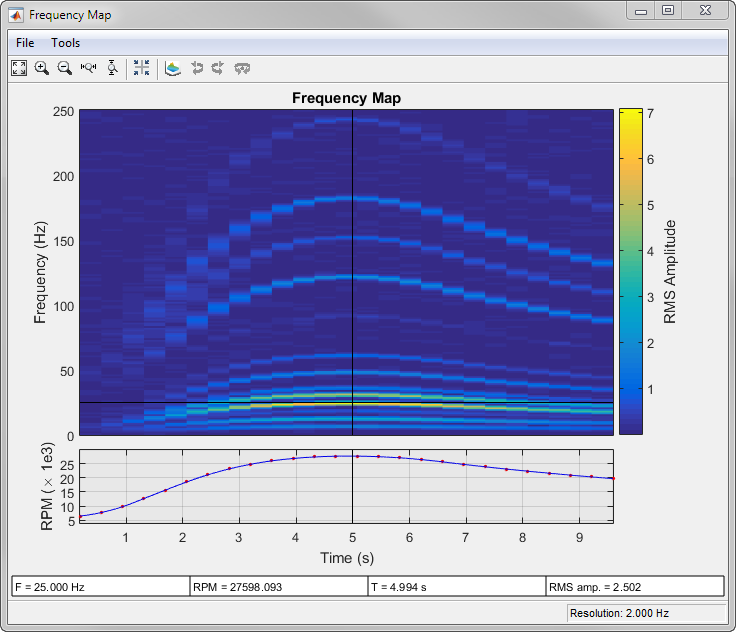
Move the crosshair cursors in the figure to determine the RPM and the RMS amplitude at a frequency of 25 Hz after 5 seconds.
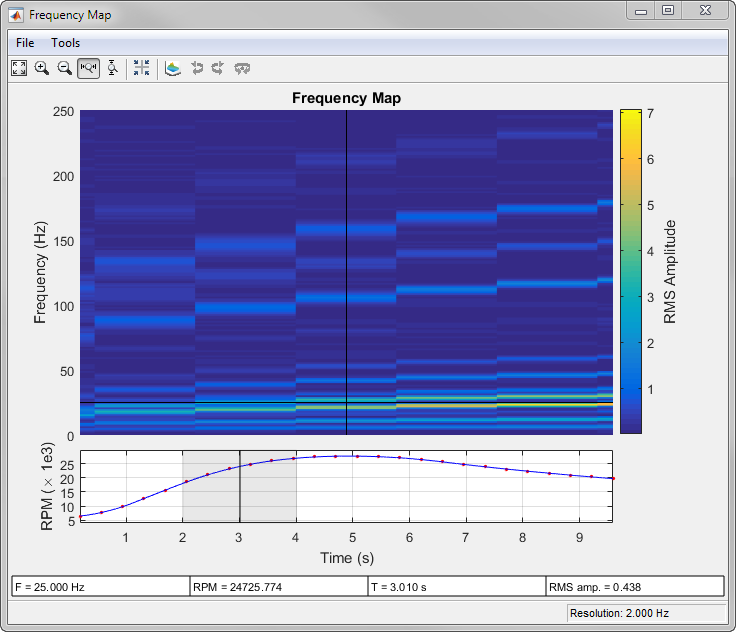
Click the Zoom X button ![]() in the toolbar to zoom into the time
region between 2 and 4 seconds. A panner appears in the bottom
plot.
in the toolbar to zoom into the time
region between 2 and 4 seconds. A panner appears in the bottom
plot.
Click the Waterfall Plot button
![]() in the toolbar to display the
frequency-RPM map as a waterfall plot. For improved visibility, rotate the
plot clockwise using the Rotate Left button
in the toolbar to display the
frequency-RPM map as a waterfall plot. For improved visibility, rotate the
plot clockwise using the Rotate Left button
![]() three times. Move the panner to the
interval between 4 and 6 seconds.
three times. Move the panner to the
interval between 4 and 6 seconds.
Input Arguments
Name-Value Arguments
Output Arguments
References
[1] Brandt, Anders. Noise and Vibration Analysis: Signal Analysis and Experimental Procedures. Chichester, UK: John Wiley & Sons, 2011.
Extended Capabilities
Version History
Introduced in R2015bSee Also
orderspectrum | ordertrack | orderwaveform | rpmordermap | rpmtrack | spectrogram | tachorpm