getLabeledSignal
Get labeled signals from labeled signal set
Description
Examples
Load a labeled signal set containing recordings of whale songs.
load whales
lss
lss =
labeledSignalSet with properties:
Source: {2×1 cell}
NumMembers: 2
TimeInformation: "sampleRate"
SampleRate: 4000
Labels: [2×3 table]
Description: "Characterize wave song regions"
Use labelDefinitionsHierarchy to see a list of labels and sublabels.
Use setLabelValue to add data to the set.
Get a table with all the signals in lss.
t = getLabeledSignal(lss)
t=2×4 table
                      Signal         WhaleType    MoanRegions    TrillRegions
                 ________________    _________    ___________    ____________

    Member{1}    {79572×1 double}      blue       {3×2 table}    {1×3 table}
    Member{2}    {76579×1 double}      blue       {3×2 table}    {1×3 table}
Identify the sublabels of the trill regions.
d = getLabelNames(lss,"TrillRegions")d = "TrillPeaks"
Get the labeled signal corresponding to the second member of the set. Determine the sample rate.
idx = 2;

[lbs,info] = getLabeledSignal(lss,idx)
lbs=1×4 table
                      Signal         WhaleType    MoanRegions    TrillRegions
                 ________________    _________    ___________    ____________

    Member{2}    {76579×1 double}      blue       {3×2 table}    {1×3 table}
info = struct with fields:
    TimeInformation: "sampleRate"
         SampleRate: 4000
fs = info.SampleRate;
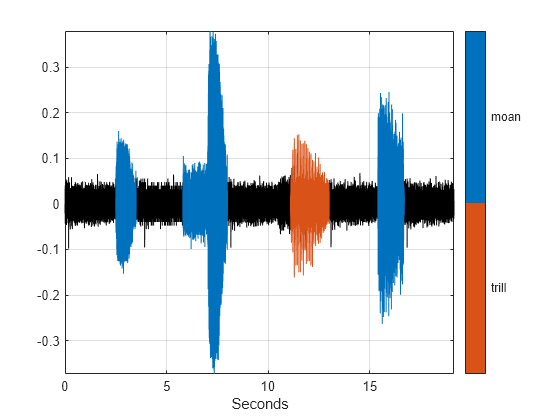
Identify the moan and trill regions of interest. Use a signalMask object to plot the signal and highlight the moans and trills.
mvals = getLabelValues(lss,idx,"MoanRegions");
tvals = getLabelValues(lss,idx,"TrillRegions");

tb = [mvals;tvals];
tb.Value = categorical([repmat("moan",height(mvals),1); ...
    repmat("trill",height(tvals),1)],["moan" "trill"]);
sm = signalMask(tb,"SampleRate",fs);
plotsigroi(sm,getSignal(lss,idx))
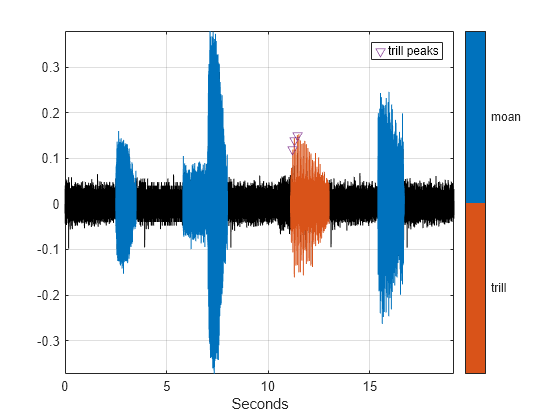
Identify three peaks of the trill region and plot them.
peaks = getLabelValues(lss,idx,["TrillRegions" "TrillPeaks"]);

hold on
pk = plot(peaks.Location,cell2mat(peaks.Value),"v");
hold off
legend(pk,"trill peaks")