rfckt.passive
Passive component or network
Description
Use the passive class to represent passive RF components
and networks that are characterized by passive network parameter data.
Use the read method to read the passive object
data from a Touchstone data file. When you read S-parameter data into an
rfckt.passive object, the magnitude of your
S21 data must be less than or equal to
1.
Due to random numerical error, data measured from a passive device is not necessarily
passive. However, rfckt.passive objects can only contain passive
data. To import data with active regions, use the rfckt.amplifier
object, even if the original data represents a passive device.
Note
nport is
recommend over rfckt.passive because it enables you to:
Create passive RF S-parameter components and networks that are characterized by passive network parameter data.
Model a passive RF S-parameter components in an RF chain created using an
rfbudgetobject or the RF Budget Analyzer app.Export the passive RF S-parameter components to RF Blockset™ or to
rfsystemSystem object™ for circuit envelope or idealized baseband analysis.
(since R2023b)
Creation
Description
h = rfckt.passive returns an passive-device object
whose properties all have their default values.
h = rfckt.passive(Name,Value) sets properties using
one or more name-value pairs. For example,
rfckt.passive('IntpType','cubic') creates an
passive-device object with piecewise cubic Hermite interpolation as
interpolation method. You can specify multiple name-value pairs. Enclose
each property name in a quote. Properties not specified retain their default
values.
Properties
Object Functions
analyze | Analyze RFCKT object in frequency domain |
calculate | Calculate specified parameters for rfckt objects or rfdata objects |
circle | Draw circles on Smith Chart |
extract | Extract specified network parameters from rfckt object or data object |
listformat | List valid formats for specified circuit object parameter |
listparam | List valid parameters for specified circuit object |
loglog | Plot specified circuit object parameters using log-log scale |
plot | Plot circuit object parameters on X-Y plane |
plotyy | Plot parameters of RF circuit or RF data on xy-plane with two Y-axes |
getop | Display operating conditions |
polar | Plot specified object parameters on polar coordinates |
semilogx | Plot RF circuit object parameters using log scale for x-axis |
semilogy | Plot RF circuit object parameters using log scale for y-axis |
smith | Plot circuit object parameters on Smith Chart |
write | Write RF data from circuit or data object to file |
getz0 | Calculate characteristic impedance of RFCKT transmission line object |
read | Read RF data from file to new or existing circuit or data object |
restore | Restore data to original frequencies |
getop | Display operating conditions |
groupdelay | Group delay of S-parameter, RF filter, or RF Toolbox circuit object |
Examples
Algorithms
The analyze method computes the AnalyzedResult
property as follows:
The analyze method uses the data stored in the
'NetworkData' property of the rfckt.passive
object to calculate the S-parameter values of the passive component at the frequencies
specified in freq. If the 'NetworkData' property
contains network Y- or Z-parameters, the analyze method first
converts the parameters to S-parameters. Using the interpolation method you specify with
the 'IntpType' property, the analyze method
interpolates the S-parameter values to determine their values at the specified
frequencies.
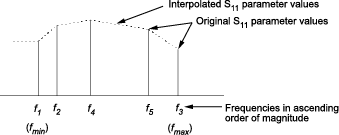
Specifically, the analyze method orders the S-parameters according
to the ascending order of their frequencies,
fn. It then interpolates the S-parameters,
using the MATLAB®
interp1 function. For example, the
curve in the following diagram illustrates the result of interpolating the
S11 parameters at five different frequencies.
For more information, see “One-Dimensional Interpolation”
and the interp1 reference page in the
MATLAB documentation.
As shown in the preceding diagram, the analyze method uses the
parameter values at fmin, the minimum input
frequency, for all frequencies smaller than
fmin. It uses the parameters values at
fmax, the maximum input frequency, for
all frequencies greater than fmax. In both
cases, the results may not be accurate, so you need to specify network parameter values
over a range of frequencies that is wide enough to account for the component
behavior.
The analyze method uses the S-parameters to calculate the group
delay values at the frequencies specified in the analyze input
argument freq, as described in the analyze
reference page.
References
[1] EIA/IBIS Open Forum, Touchstone File Format Specification, Rev. 1.1, 2002
Version History
Introduced in R2009a