allanvar
Allan variance
Syntax
Description
Allan variance is used to measure the frequency stability of oscillation for a sequence of data in the time domain. It can also be used to determine the intrinsic noise in a system as a function of the averaging time. The averaging time series τ can be specified as τ = m/fs. Here fs is the sampling frequency of data, and m is a list of ascending averaging factors (such as 1, 2, 4, 8, …).
[
returns the Allan variance avar,tau] = allanvar(Omega)avar as a function of averaging time
tau. The default averaging time tau is an octave
sequence given as (1, 2, ...,
2floor{log2[(N-1)/2]}),
where N is the number of samples in Omega. If
Omega is specified as a matrix, allanvar operates
over the columns of omega.
Examples
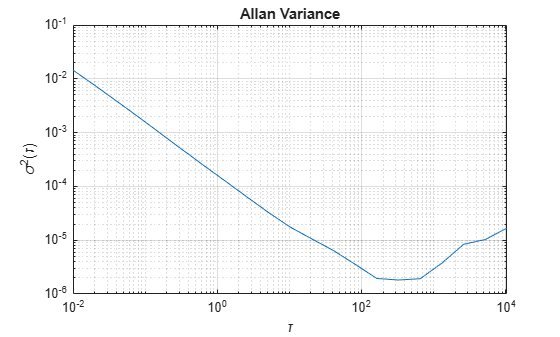
Load gyroscope data from a MAT file, including the sample rate of the data in Hz. Calculate the Allan variance.
load('LoggedSingleAxisGyroscope','omega','Fs')
[avar,tau] = allanvar(omega,'octave',Fs);
Plot the Allan variance on a loglog plot.
loglog(tau,avar)
xlabel('\tau')
ylabel('\sigma^2(\tau)')
title('Allan Variance')
grid on
Generate sample gyroscope noise, including angle random walk and rate random walk.
numSamples = 1e6;
Fs = 100;
nStd = 1e-3;
kStd = 1e-7;
nNoise = nStd.*randn(numSamples,1);
kNoise = kStd.*cumsum(randn(numSamples,1));
omega = nNoise+kNoise;
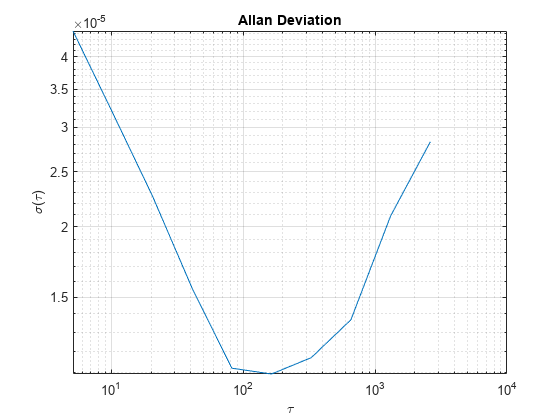
Calculate the Allan deviation at specific values of . The Allan deviation is the square root of the Allan variance.
m = 2.^(9:18);
[avar,tau] = allanvar(omega,m,Fs);
adev = sqrt(avar);
Plot the Allan deviation on a loglog plot.
loglog(tau,adev)
xlabel('\tau')
ylabel('\sigma(\tau)')
title('Allan Deviation')
grid on
Input Arguments
Output Arguments
Version History
Introduced in R2019a