Main Content

simplify

Reduce multigraph to simple graph

Description

example

H = simplify(G) returns a graph without multiple edges or self-loops. When several edges occur between the same two nodes, only the first edge (as defined in G.Edges) is kept. Edge properties are preserved.

example

H = simplify(G,pickmethod) specifies a method to choose between multiple edges. Edge properties are preserved. pickmethod can be 'first' (default), 'last', 'min', or 'max'.

example

H = simplify(G,aggregatemethod) specifies a method to combine the edge weights of multiple edges into the weight of a single new edge. All other edge properties in G are dropped. aggregatemethod can be 'sum' or 'mean'.

example

H = simplify(___,selfloopflag) specifies whether to preserve or remove self-loops from the graph using any of the input argument combinations in previous syntaxes. For example, 'keepselfloops' specifies that nodes with one or more self-loops will have one self-loop in the simplified graph.

H = simplify(___,Name,Value) specifies additional options with one or more name-value pair arguments. For example, you can specify 'PickVariable' and a variable in G.Edges to use that variable with the 'min' or 'max' selection methods.

example

[H,eind,ecount] = simplify(___) additionally returns edge indices eind and edge counts ecount:

  • H.Edges(eind(i),:) is the edge in H that represents edge i in G.

  • ecount(j) is the number of edges in G that correspond to edge j in H.

Examples

collapse all

Create a weighted, undirected multigraph with several edges between node 1 and node 2.

G = graph([1 1 1 1 2 3],[2 2 2 3 3 4], 1:6);
G.Edges
ans=6×2 table
    EndNodes    Weight
    ________    ______

     1    2       1   
     1    2       2   
     1    2       3   
     1    3       4   
     2    3       5   
     3    4       6   

Simplify the multigraph into a simple graph, such that there is only one edge between node 1 and node 2. simplify keeps the first edge between those two nodes, G.Edges(1,:), and drops the others.

G = simplify(G);
G.Edges
ans=4×2 table
    EndNodes    Weight
    ________    ______

     1    2       1   
     1    3       4   
     2    3       5   
     3    4       6   

Use the second input of simplify to select a method that picks between multiple edges or combines multiple edges into one.

Create a weighted multigraph. In this graph, five edges occur between node 3 and node 4, but the edges have random weights. View the edges table and plot the graph for reference.

G = graph([1 2 3 3 3 3 3 3 ],[2 3 1 4 4 4 4 4],randi(10,1,8));
G.Edges
ans=8×2 table
    EndNodes    Weight
    ________    ______

     1    2        9  
     1    3        2  
     2    3       10  
     3    4       10  
     3    4        7  
     3    4        1  
     3    4        3  
     3    4        6  

plot(G,'EdgeLabel',G.Edges.Weight)

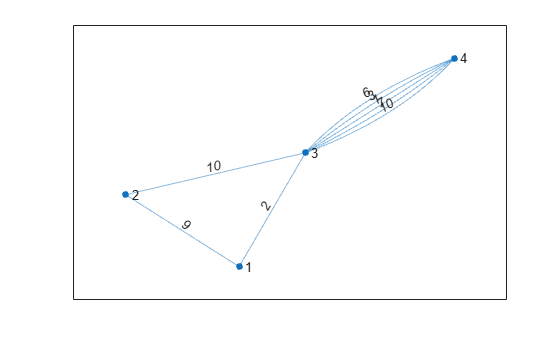
The command simplify(G) keeps the first of the repeated edges. However, you can specify a different pick/combine method with the second input.

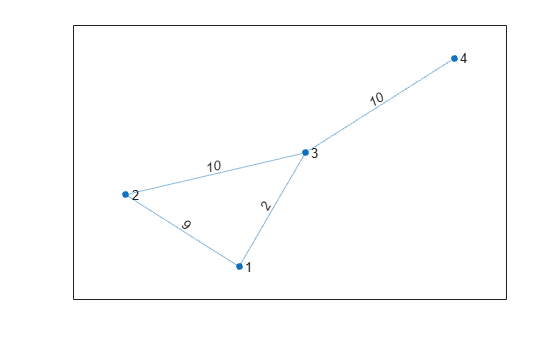
The options for picking between multiple edges are: 'first' (default), 'last', 'min', and 'max'. Keep the repeated edge with maximum weight.

H_pick = simplify(G,'max');
plot(H_pick,'EdgeLabel',H_pick.Edges.Weight)

The options for combining multiple edges into one are: 'sum' and 'mean'. Sum repeated edges together to produce a single edge with a larger weight.

H_comb = simplify(G,'sum');
plot(H_comb,'EdgeLabel',H_comb.Edges.Weight)

Simplify a graph while preserving self-loops using the 'keepselfloops' option.

Create a multigraph with two nodes and several self-loops. Simplify the graph and preserve self-loops.

G = graph([1 1 1 1 1 1 1 2 2 2 2],[1 1 1 1 2 2 2 2 2 2 2 ]);
plot(G)
axis equal

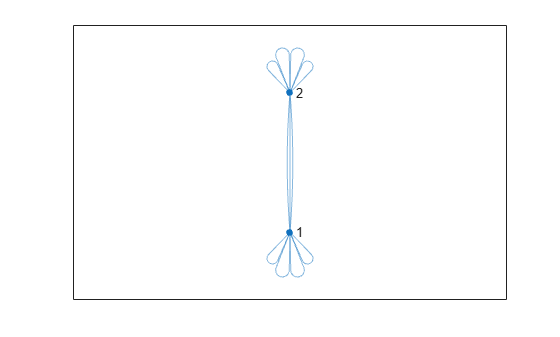
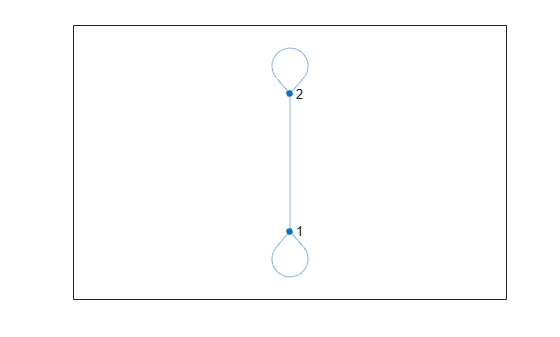
G = simplify(G,'keepselfloops');
plot(G)
axis equal

Use the second and third outputs of simplify to get information about how many (and which) edges are combined.

Create an undirected multigraph with three nodes and four edges.

G = graph([1 1 1 2],[2 2 3 3]);
G.Edges
ans=4×1 table
    EndNodes
    ________

     1    2 
     1    2 
     1    3 
     2    3 

Simplify the graph and specify three outputs to get additional information about the combined edges.

[G,ei,ec] = simplify(G)
G = 
  graph with properties:

    Edges: [3x1 table]
    Nodes: [3x0 table]

ei = 4×1

     1
     1
     2
     3

ec = 3×1

     2
     1
     1

ei(i) is the edge in the simplified graph that represents edge i in the old graph. Since the first two edges are repeated, ei(1) = ei(2) = 1. Also, ec(1) = 2, since there are two edges in the new graph corresponding to edge 1 in the old graph.

Show how to simplify a multigraph using the 'PickVariable' and 'AggregationVariables' name-value pairs.

Create a multigraph where the nodes represent locations and the edges represent modes of transport. The edges have properties that reflect the cost and time of each mode of transportation. Preview the edges table.

G = graph([1 1 1 1 1 1 2 2 2],[2 2 2 3 3 3 3 3 3],[],{'New York', 'Boston', 'Washington D.C.'});
G.Edges.Mode = categorical([1 2 3 1 2 3 1 2 3],[1 2 3],{'Air' 'Train' 'Bus'})';
G.Edges.Cost = [400 80 40 250 100 75 325 150 100]';
G.Edges.Time = [1 7 5 1.5 10 8 1.75 11 9]';
G.Edges
ans=9×4 table
                 EndNodes                  Mode     Cost    Time
    ___________________________________    _____    ____    ____

    {'New York'}    {'Boston'         }    Air      400        1
    {'New York'}    {'Boston'         }    Train     80        7
    {'New York'}    {'Boston'         }    Bus       40        5
    {'New York'}    {'Washington D.C.'}    Air      250      1.5
    {'New York'}    {'Washington D.C.'}    Train    100       10
    {'New York'}    {'Washington D.C.'}    Bus       75        8
    {'Boston'  }    {'Washington D.C.'}    Air      325     1.75
    {'Boston'  }    {'Washington D.C.'}    Train    150       11
    {'Boston'  }    {'Washington D.C.'}    Bus      100        9

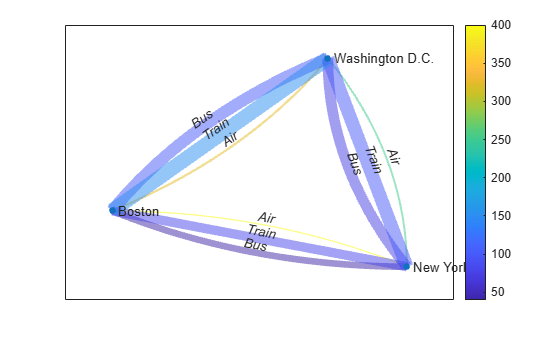
Plot the graph for reference. Label the transportation mode on each edge, make the edge line widths proportional to the time, and the color of each edge proportional to the cost.

plot(G,'EdgeLabel',cellstr(G.Edges.Mode),'LineWidth',G.Edges.Time./min(G.Edges.Time),'EdgeCData',G.Edges.Cost)
colorbar

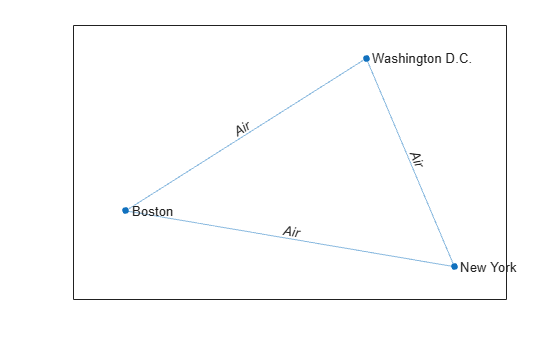
Use the 'min' selection method and specify the value of 'PickVariable' as the 'Time' variable to find the quickest mode of transport between each set of nodes.

t = simplify(G,'min','PickVariable','Time');
plot(t,'EdgeLabel',cellstr(t.Edges.Mode))

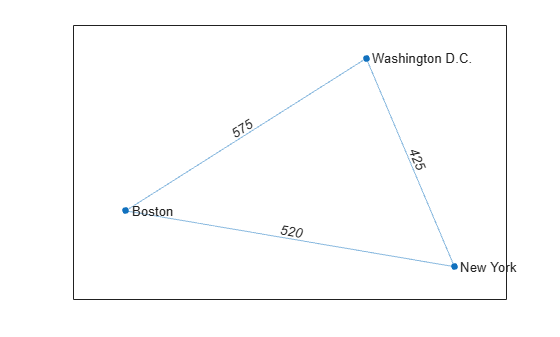
Use the 'sum' aggregation method and specify the value of 'AggregationVariables' as 'Cost' to compute how much money is made on each connection.

c = simplify(G,'sum','AggregationVariables','Cost');
plot(c,'EdgeLabel',c.Edges.Cost)

Input Arguments

collapse all

Input graph, specified as either a graph or digraph object. Use graph to create an undirected graph or digraph to create a directed graph.

Example: G = graph(1,2)

Example: G = digraph([1 2],[2 3])

Edge picking method, specified as 'first', 'last', 'min', or 'max'. The edge picking method provides a way to choose which of several edges to preserve when more than one edge exists between the same two nodes.

  • If the method is 'first' or 'last', then simplify preserves only the first or last edge that occurs in the edges table G.Edges.

  • If the method is 'min' or 'max', then simplify preserves only the edge with minimum or maximum weight. The Weight variable must exist in G.Edges, unless you use the 'PickVariable' name-value pair to base the selection on a different variable.

Example: simplify(G,'last')

Aggregation method, specified as either 'sum' or 'mean'. The aggregation method provides a way to combine several edges into a single edge when there is more than one edge between the same two nodes.

By default, simplify only sums or averages the edge weights in the graph and drops all other edge properties. However, you can use the 'AggregationVariables' name-value pair to specify which numeric variables in G.Edges to preserve and aggregate.

Example: simplify(G,'sum')

Toggle to keep self-loops, specified as either:

  • 'omitselfloops' — Remove all self-loops from the graph. This is the default.

  • 'keepselfloops' — Nodes with one or more self-loops have a single self-loop in the simplified graph.

Example: simplify(G,'sum','keepselfloops')

Name-Value Arguments

Specify optional pairs of arguments as Name1=Value1,...,NameN=ValueN, where Name is the argument name and Value is the corresponding value. Name-value arguments must appear after other arguments, but the order of the pairs does not matter.

Before R2021a, use commas to separate each name and value, and enclose Name in quotes.

Example: H = simplify(G,'sum','AggregationVariables',{'Var1' 'Var2'})

Variable to base edge selection on, specified as the comma-separated pair consisting of 'PickVariable' and a variable name or numeric index. Use this name-value pair to select an edge variable in G.Edges other than 'Weight' to use with the 'min' or 'max' picking methods. simplify preserves only the edge with the minimum or maximum value of the selected variable when there are several edges between the same two nodes.

Example: simplify(G,'min','PickVariable',3)

Example: simplify(G,'min','PickVariable','var3')

Data Types: single | double | int8 | int16 | int32 | int64 | uint8 | uint16 | uint32 | uint64 | char | string

Variables to aggregate, specified as the comma-separated pair consisting of 'AggregationVariables' and a variable name, cell array of variable names, string array, numeric vector, logical vector, or function handle. Use this name-value pair to select one or more edge variables in G.Edges that can be combined with the 'sum' or 'mean' aggregation methods. simplify combines the values of these variables into a single value for one new edge when there are several edges between the same two nodes. The value of 'AggregationVariables' can be one of the following:

  • Character vector specifying a single table variable name

  • Cell array of character vectors where each element is a table variable name

  • String array specifying one or more variable names

  • Vector of table variable indices

  • Logical vector whose elements correspond to table variables, where true includes the corresponding variable and false excludes it

  • A function handle that takes the G.Edges table as input and returns a logical scalar, such as @isnumeric

Example: simplify(G,'sum','AggregationVariables',[4 5 6])

Example: simplify(G,'mean','AggregationVariables',{'var5 var7'})

Example: simplify(G,'mean','AggregationVariables',@isnumeric)

Data Types: single | double | logical | function_handle | char | string | cell

Output Arguments

collapse all

Simplified graph, returned as a graph or digraph object. H does not contain any repeated edges between the same two nodes, such that ismultigraph(H) returns logical 0 (false). Self-loops also are removed, unless you specify the 'keepselfloops' option.

Edge indices, returned as a vector. The edge in H that represents edge i in G is given by H.Edges(eind(i),:). If edge i in G is a self-loop that was removed, then eind(i) is 0.

Edge counts, returned as a vector. ecount(i) is the number of edges in G that correspond to edge i in H.

Extended Capabilities

Thread-Based Environment
Run code in the background using MATLAB® backgroundPool or accelerate code with Parallel Computing Toolbox™ ThreadPool.

Version History

Introduced in R2018a