binscatter
Binned scatter plot

Syntax
Description
Vector Data
binscatter(
displays a binned scatter plot for vectors x,y)x and
y. A binned scatter plot partitions the data space into
rectangular bins and displays the count of data points in each bin using
different colors. When zooming into the plot, the bin sizes automatically adjust
to show finer resolution.
Table Data
Additional Options
binscatter(___,
specifies property values with one or more name-value pair arguments. For
example, you can specify Name,Value)'ShowEmptyBins' as
'on' to color areas with no data points. For a full list
of properties, see Binscatter Properties. Use this option with any of the input argument
combinations in previous syntaxes.
binscatter( plots
into the axes specified by ax,___)ax instead of into the current
axes (gca). The ax input can precede any
of the input argument combinations in previous syntaxes.
Examples
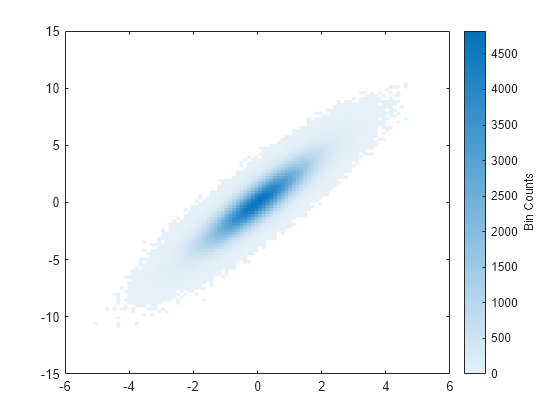
Generate random numbers in both the x and y dimensions and create a binned scatter plot. The binscatter function automatically chooses an appropriate number of bins to cover the range of values in the data.
x = randn(1e6,1);
y = 2*x + randn(1e6,1);
binscatter(x,y)
Plot a binned scatter plot of 10,000 random numbers sorted into 30 bins in the x dimension and 10 bins in the y dimension.
rng default % for reproducibility
x = randn(1e4,1);
y = randn(1e4,1);
h = binscatter(x,y,[30 10]);
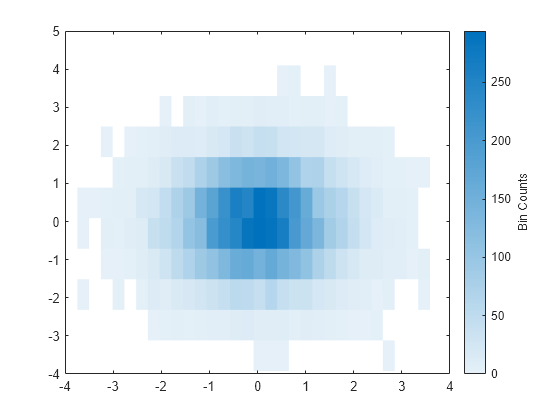
Find the bin counts. The result is a matrix with the top left element corresponding to the bin count of the bottom left bin in the plot. The x bins are in the rows of the matrix and the y bins are in the columns.
counts = h.Values;
Since R2026a
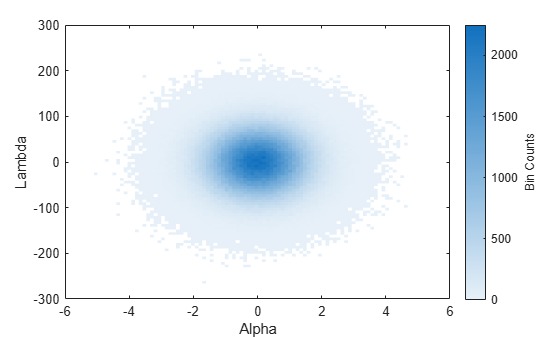
Create a table and plot the variables. When you pass a table to the binscatter function, the axis labels display the variable names.
Alpha = randn(1e6,1);
Lambda = 50*randn(1e6,1);
tbl = table(Alpha,Lambda);
binscatter(tbl,"Alpha","Lambda")
Create a binned scatter plot of some random data points.
x = randn(1e5,1);
y = randn(1e5,1);
binscatter(x,y)

The default color map ranges from light colors (for small values) to dark colors (for large values). Switching to a color map that uses dark colors for small values can make it easier to spot outliers.
Use the colormap function to change the colors in the plot. Pass in the current axes handle using gca.
colormap(gca,'parula')
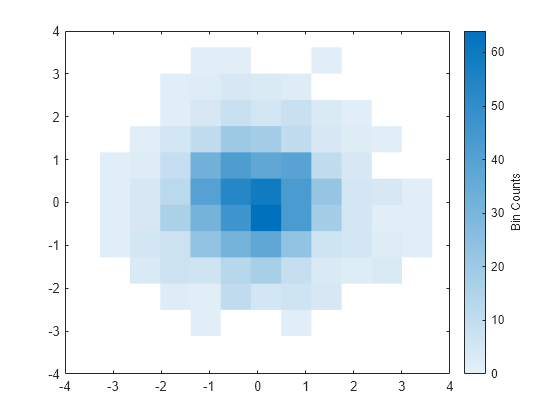
Generate 1,000 random numbers and create a binned scatter plot. Return the Binscatter object to adjust properties of the plot without recreating the entire plot.
x = randn(1000,1);
y = randn(1000,1);
h = binscatter(x,y)
h =
  Binscatter with properties:

      NumBins: [11 11]
    XBinEdges: [-3.2764 -2.6485 -2.0206 -1.3927 -0.7648 -0.1369 0.4910 1.1189 1.7468 2.3747 3.0026 3.6305]
    YBinEdges: [-3.1155 -2.5034 -1.8914 -1.2794 -0.6674 -0.0553 0.5567 1.1687 1.7808 2.3928 3.0048 3.6168]
       Values: [11×11 double]
      XLimits: [-3.2764 3.6305]
      YLimits: [-3.1155 3.6168]
    FaceAlpha: 1

  Show all properties
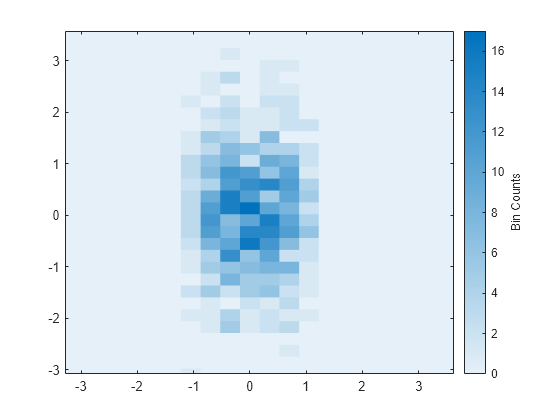
Specify exactly how many bins to use in each direction.
h.NumBins = [20 30];

Turn on the display of empty bins in the plot.
h.ShowEmptyBins = 'on';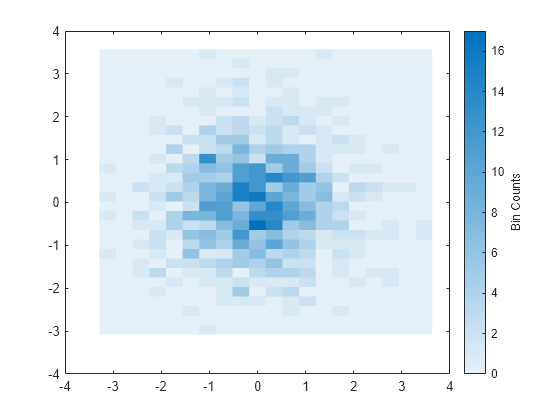
Specify the extent of the axes with the XLimits and YLimits properties. Then limit the bin limits in the x direction with a vector.
xlim(gca,h.XLimits);
ylim(gca,h.YLimits);
h.XLimits = [-1 1];
Input Arguments
Name-Value Arguments
Output Arguments
Tips
Change the
ColorScaleproperty of the axes to'log'to produce better bin coloring when a few bins dominate the plot.ax = gca; ax.ColorScale = 'log';
Extended Capabilities
Version History
Introduced in R2017bSee Also
histogram | histogram2 | histcounts2 | histcounts | scatter